


pChart is an open source chart generation library, mainly involving 3 Classes: pChart.class, pData.class, pCache.class, which can generate more than 20 types Simple or complex charts, supporting common image formats such as PNG, JPG, and GIF. The data source can come from Database, CSV, or handwritten. To use this program PHP, you need to enable the GD service. Let’s take a look at the workflow of pChart first:
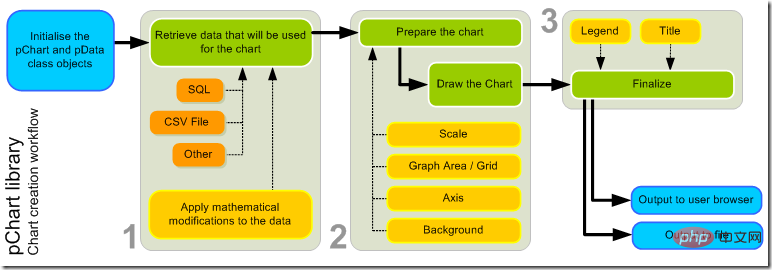
##Related learning recommendations:It is mainly divided into three steps:
<?php
// Standard inclusions
include("pChart/pData.class");
include("pChart/pChart.class");
// Dataset definition
$DataSet = new pData;
//图表数据
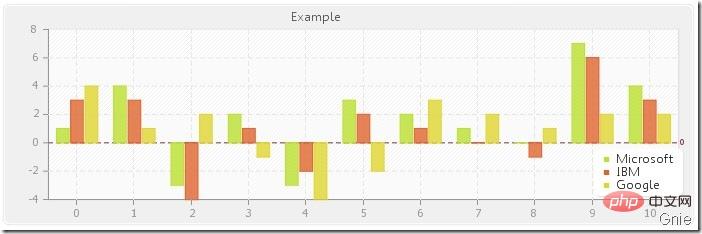
$DataSet->AddPoint(array(1,4,-3,2,-3,3,2,1,0,7,4),"Serie1");
$DataSet->AddPoint(array(3,3,-4,1,-2,2,1,0,-1,6,3),"Serie2");
$DataSet->AddPoint(array(4,1,2,-1,-4,-2,3,2,1,2,2),"Serie3");
$DataSet->AddAllSeries();
$DataSet->SetAbsciseLabelSerie();
//数据图例
$DataSet->SetSerieName("Microsoft","Serie1");
$DataSet->SetSerieName("IBM","Serie2");
$DataSet->SetSerieName("Google","Serie3");
// Initialise the graph
$Test = new pChart(700,230);
//设置图表尺寸、样式
$Test->setFontProperties("Fonts/tahoma.ttf",8);
$Test->setGraphArea(50,30,680,200);
$Test->drawFilledRoundedRectangle(7,7,693,223,5,240,240,240);
$Test->drawRoundedRectangle(5,5,695,225,5,230,230,230);
$Test->drawGraphArea(255,255,255,TRUE);
$Test->drawScale($DataSet->GetData(),$DataSet->GetDataDescription(),SCALE_NORMAL,150,150,150,TRUE,0,2,TRUE);
$Test->drawGrid(4,TRUE,230,230,230,50);
// Draw the 0 line
$Test->setFontProperties("Fonts/MankSans.ttf",6);
$Test->drawTreshold(0,143,55,72,TRUE,TRUE);
// Draw the bar graph
//柱状图要使用drawBarGraph()
$Test->drawBarGraph($DataSet->GetData(),$DataSet->GetDataDescription(),TRUE,80);
// Finish the graph
//制作图例、标题、字体等属性
$Test->setFontProperties("Fonts/MankSans.ttf",10);
$Test->drawLegend(596,150,$DataSet->GetDataDescription(),255,255,255);
$Test->setFontProperties("Fonts/MankSans.ttf",10);
$Test->drawTitle(50,22,"Example",50,50,50,585);
//生成图表
$imageFile = "example12.png";
$Test->Render($imageFile);
echo '<img src="'.$imageFile.'">';
?> ##Code:
<?php
// Standard inclusions
include("pChart/pData.class");
include("pChart/pChart.class");
// Dataset definition
$DataSet = new pData;
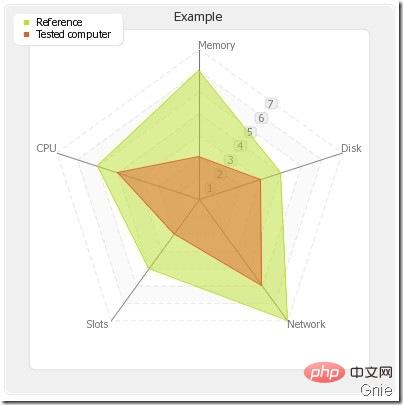
$DataSet->AddPoint(array("Memory","Disk","Network","Slots","CPU"),"Label");
$DataSet->AddPoint(array(6,4,7,4,5),"Serie1");
$DataSet->AddPoint(array(2,3,5,2,4),"Serie2");
$DataSet->AddSerie("Serie1");
$DataSet->AddSerie("Serie2");
$DataSet->SetAbsciseLabelSerie("Label");
$DataSet->SetSerieName("Reference","Serie1");
$DataSet->SetSerieName("Tested computer","Serie2");
// Initialise the graph
$Test = new pChart(400,400);
$Test->setFontProperties("Fonts/tahoma.ttf",8);
$Test->drawFilledRoundedRectangle(7,7,393,393,5,240,240,240);
$Test->drawRoundedRectangle(5,5,395,395,5,230,230,230);
$Test->setGraphArea(30,30,370,370);
$Test->drawFilledRoundedRectangle(30,30,370,370,5,255,255,255);
$Test->drawRoundedRectangle(30,30,370,370,5,220,220,220);
// Draw the radar graph
//要使用drawRadarAxis()生成雷达效果
$Test->drawRadarAxis($DataSet->GetData(),$DataSet->GetDataDescription(),TRUE,20,120,120,120,230,230,230);
$Test->drawFilledRadar($DataSet->GetData(),$DataSet->GetDataDescription(),50,20);
// Finish the graph
$Test->drawLegend(15,15,$DataSet->GetDataDescription(),255,255,255);
$Test->setFontProperties("Fonts/tahoma.ttf",10);
$Test->drawTitle(0,22,"Example",50,50,50,400);
$imageFile = "example8.png";
$Test->Render($imageFile);
echo '<img src="'.$imageFile.'">';
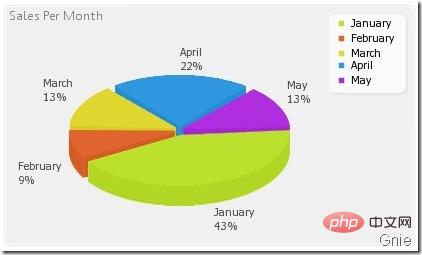
?>Let’s look at a few others The effect is
1, pie chart:
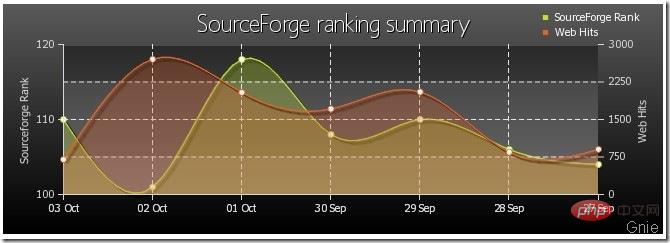
 2, two-coordinate curve chart:
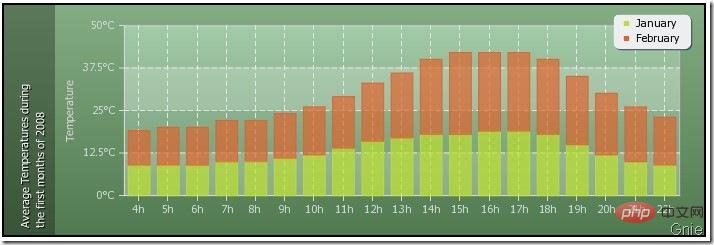
 3, Stacked bar chart:
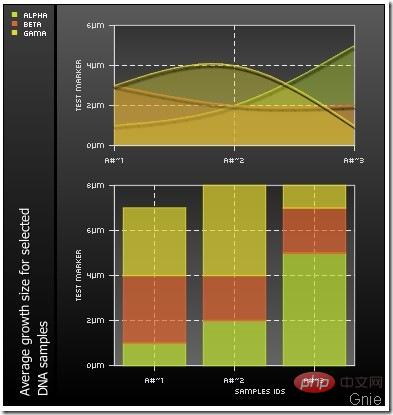
 4, Multiple charts:
 The types of charts are quite similar Enriched, please refer to
http://pchart.sourceforge.net/documentation.php?topic=pChart
::Source code download:::
http://xiazai.jb51.net/202007/yuanma/pChart_jb51.rar
The above is the detailed content of Example of parsing PHP to generate chart pChart. For more information, please follow other related articles on the PHP Chinese website!
 How to shut down after running the nohup command
 How to solve problems when parsing packages
 The difference between arrow functions and ordinary functions
 The use of declare in Oracle
 append usage
 How to connect broadband to server
 python configure environment variables
 What are the main characteristics of computers?


![[Web front-end] Node.js quick start](https://img.php.cn/upload/course/000/000/067/662b5d34ba7c0227.png)


