The following content is related to the suggestions and techniques on how to debug JavaScript. Please see below for specific details.
Browser Developer Tools
My personal favorite is Chrome Developer Tools. While Safari and Firefox can't meet Chrome's high standards, they are gradually improving. In Firefox, you can use Firebug and Firefox Developer Tools together. If the Firefox team continues to excel in improving built-in developer tools, Firebug may one day become obsolete.
Personal preferences aside, you should be able to experiment and debug arbitrary code in the target browser. Your target browser may or may not include the famous IE8.
Be familiar with the developer tools of your choice. You can also get additional debugging support from an IDE (Integrated Development Environment) or third-party software.
In various debugging tools, the basic knowledge of debugging is the same. In fact, I learned the basics of debugging from Borland's C developer environment in the 90s. Breakpoints, conditional breakpoints, and watches are exactly the same as the latest version of Chrome Developer Tools. Around 2000, I caught my first exception in Java. The concept of stack traces still applies, and even though JavaScript terminology refers to it as an Error, inspecting a stack trace is still as useful as ever.
Some knowledge points are unique to front-end development. For example:
DOM inspection
DOM breakpoint
Debug events
Memory leak analysis
Breakpoint
Use the debugger statement to add breakpoints in the source code. Once the debugger statement is reached, execution is interrupted. The context of the current scope appears in the console, along with all local and global variables. Move the mouse cursor over a variable to view its value.
You can also create conditional breakpoints in your code:
JavaScript
if (condition) {
 debugger;
}You can also insert breakpoints and conditional breakpoints in the developer tools according to your needs. In Chrome developer tools, click the line number in the Sources view to add a breakpoint. You can also add breakpoint conditions if you right-click on a breakpoint and select "Edit Breakpoint."
Breakpoint for node changes
If your task is to debug garbage code, you may have this question: why DOM nodes changed during execution. Chrome developer tools provide a convenient breakpoint that can be used to detect node changes in the element tree.
In the Elements view, right-click an element and select "Break on..." from the right-click menu.

Breakpoints for node changes
Types of DOM breakpoints may include:
Node changes in the sub-tree of the selected node,
The properties of the selected node change,
The node is deleted.
Avoid logging reference types
When recording an object or array, the value of the primitive type may change in the reference object record. When viewing reference types it is important to remember that code execution during recording and viewing may affect the observed results.
For example, execute the following code in Chrome Developer Tools:
JavaScript
var wallets = [{ amount: 0 }];
setInterval( function() {
 console.log( wallets, wallets[0], wallets[0].amount );
 wallets[0].amount += 100;
}, 1000 );The recorded values of the second and third properties are correct, the value of the object reference in the first property is unreliable. The value of the amount field is already determined when you first display this property in the developer tools. No matter how many times you close and reopen the same reference, this value will not change.

Record Reference Type
Always remember what you are recording. When logging primitive types, use watch expressions with breakpoints. If it's asynchronous code, avoid documenting reference types.
Table record
In some developer tools, you can use console.table to record an array of objects in the console.
Try executing the following code in your Chrome developer tools:
JavaScript
console.table(
 [
 {
  id: 1,
  name: 'John',
  address: 'Bay street 1'
 },
 {
  id: 2,
  name: 'Jack',
  address: 'Valley road 2.'
 },
 {
  id: 3,
  name: 'Jim',
  address: 'Hill street 3.'
 }
 ] );
输出是非常好看的表格。所有原始类型都立刻显示出来,它们的值反应记录时的状态。也可以记录复杂类型,显示内容为其类型,内容无法显示。因此,console.table只能用来显示具有原始类型值的对象构成的二维数据结构。
XHR断点
有时你可能会遇到错误的AJAX请求。如果你无法立刻确认提交请求的代码,XHR断点可以帮你节省时间。当提交某一特殊类型的AJAX时,XHR断点将会终止代码的执行,并将提交请求的代码段呈现给用户。
在Chrome开发者工具的Sources标签页中,其中一个断点类型就是XHR断点。点击+图标,你可以输入URL片段,当AJAX请求的URL中出现这个URL片段时,JavaScript代码将会中断。
事件监听器断点
Chrome开发者工具可以捕获所有类型的事件,当用户按下一个键、点击一下鼠标时,可以对触发的事件进行调试。
异常时暂停
Chrome开发者工具可以在抛出异常时暂停执行JavaScript代码。这可以让你在Error对象被创建时观察应用的状态。

异常时暂停
代码片段
Sources标签页左侧面板上有一个代码片段(Snippet)子标签页,可用于保存代码片段,帮你调试代码。
如果你坚持使用控制台调试,反复写相同的代码,你应该将你的代码抽象成调试片段。这样的话,甚至还可以把你的调试技巧教给你的同事。
Paul Irish发布过一些基本的调试代码片段,例如在函数执行前插入断点。审查这些代码片段,并在网上搜索其他代码片段,这是很有价值的。
在函数执行前插入断点
如果你可以得到函数调用的源代码,你还可以在函数调用前插入断点来终止函数的执行。如果你想调试f函数,用debug(f)语句可以增加这种断点。
Unminify最小化代码
(译者注:unminify 解压缩并进行反混淆)
尽可能使用 source map。有时生产代码不能使用source map,但不管怎样,你都 不应该直接对生产代码进行调试。
(译者注:sourcemap 是针对压缩合并后的web代码进行调试的工具)
如果没有source map的话,你最后还可以求助于Chrome开发者工具Sources标签页中的格式化按钮(Pretty Print Button)。格式化按钮{}位于源代码文本区域的下方。格式化按钮对源代码进行美化,并改变行号,这使得调试代码更加方便,堆栈跟踪更加有效。
格式化按钮只有在不得已时才会使用。从某种意义上来说,丑代码就是难看,因为代码中的命名没有明确的语义。
DOM元素的控制台书签
Chrome开发者工具和Firebug都提供了书签功能,用于显示你在元素标签页(Chrome)或HTML标签页(Firebug)中最后点击的DOM元素。如果你依次选择了A元素、B元素和C元素,
$0 表示C元素
$1 表示B元素
$2 表示A元素
如果你又选择了元素D,那么$0、$1、$2和$3分别代表D、C、B和A。
访问调用栈
JavaScript
var f = function() { g(); }
var g = function() { h(); }
var h = function() { console.trace('trace in h'); }
f();The Sources tab in Chrome Developer Tools also displays the call stack under the Watch expression.
Performance Review
Performance review tools are often useful. These tools can be used to prevent memory leaks and can also detect areas of your site that need optimization. Since these tools don't know anything about your product, you can ignore some of their suggestions. Generally speaking, performance analysis tools are effective in scope and can make your website significantly optimized.
Examples of review tools:
Audit tab of Chrome Developer Tools
YSlow
Practice makes perfect
You may be familiar with some debugging techniques, and others will save you a lot of time. If you start using these techniques in practice, I recommend that you re-read this article after a few weeks. You'll be surprised how much your focus changes within a few weeks.
Five commonly used js debugging tools
JavaScript is called a prototype-based language. This language has many features, such as dynamic and weak typing, and it also has first class functions. Another feature is that it is a multi-paradigm language that supports object-oriented, declarative, and functional programming styles.
JavaScript was originally used as a client-side language, and browsers implemented it to provide enhanced user interfaces. JavaScript is used in many modern websites and web applications. One of the cool features of JavaScript that is also important is that I can actually use it to enhance or improve the user experience of my website. JavaScript can also provide rich functionality and interactive components.
JavaScript has become very popular as this technology develops rapidly. Because of its popularity, JavaScript has also improved a lot, and there is a lot to do to modify JavaScript scripts. This time we have brought several very useful JavaScript debugging tools to developers.
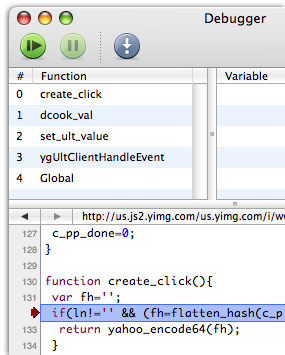
1) Drosera
Can debug any WebKit program, not just Safari.

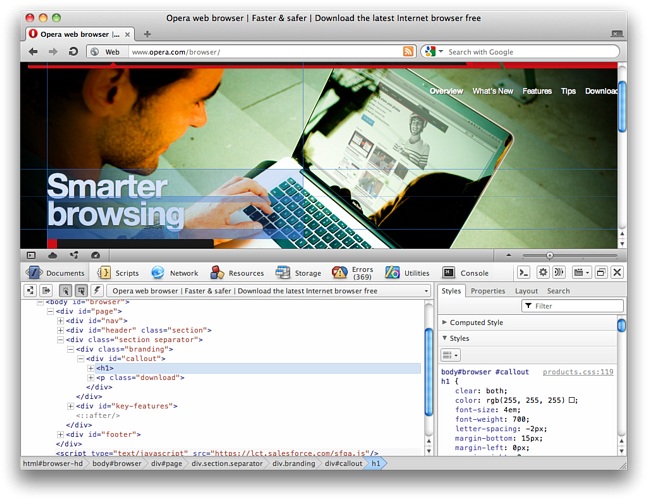
2)Dragonfly
The source code view has syntax highlighting and can set breakpoints. Powerful search function, supports regular expressions.

3) Getfirebug
Edit, debug and monitor CSS, HTML and JavaScript on any web page in real time.

4)Debugbar

5)Venkman
Venkman is the name of Mozilla’s JavaScript debugger. It is designed to provide a powerful JavaScript debugging environment for Mozilla-based browsers (Firefox, Netscape 7.x/9.x and SeaMonkey).

The above content is about suggestions and techniques on how to debug JavaScript and relevant instructions on five commonly used debugging tools. I hope you like it.


