

First enter your numbers
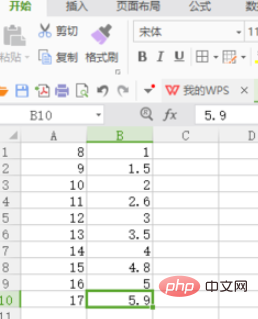
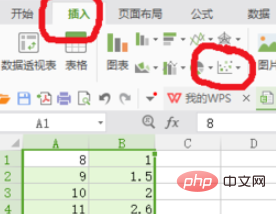
As shown in the figure, first select your two columns of cells, and then insert the XY scatter points picture.
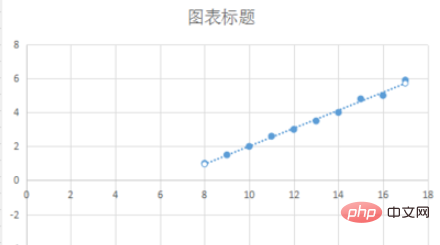
Now your scatter plot is ready. The next step is to perform linear analysis.
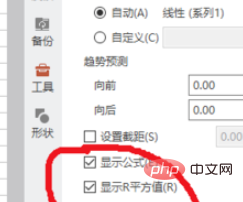
Click on the icon in the upper right corner. After entering, check "Trend Line". And click on the option in "Trend Line".
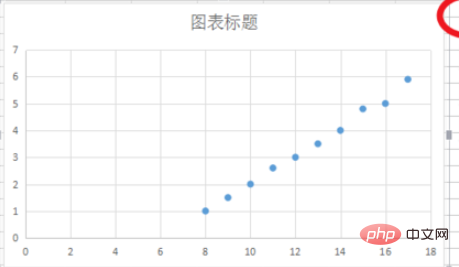
As shown. Check "Show formula" and "Show R-squared value".
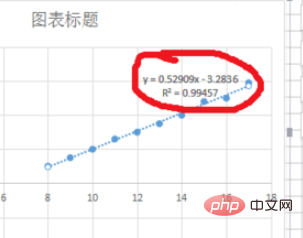
The formula and R-squared can be displayed on your graph
If you want to know more related questions, you can View:FAQ
The above is the detailed content of How to display trend line formula in wps. For more information, please follow other related articles on the PHP Chinese website!


