
#1. Use the 'print' statement
This is a basic method for debugging problems. We insert print statements at suspicious places in the program to understand the program's running flow control flow and changes in variable values.
Its disadvantage is that it requires program editing, adding a 'print' statement, and must be recompiled and rerun to obtain the output. If the program that needs to be debugged is relatively large, this will be a time-consuming and labor-intensive method.
2. Use query
In some cases, we need to figure out the status and memory mapping of a process running in the kernel. To get this information, we don't need to insert any code in the kernel. Instead, use the/procfile system. In the pseudo file system of /proc, the running information (cpu information, memory capacity, etc.) collected when the system is started is retained.
The output of ls -l /procshows that for each process running in the system, there is an entry named after the process ID in the /proc file system. Detailed information for each process can be obtained in the file in the directory corresponding to the process ID. The output of 'ls /proc/pid' can also be used.
Free video tutorial recommendation:linux video tutorial
3. Use tracking
strace and ltrace are two A tracing tool used in Linux to trace the execution details of a program.
strace:
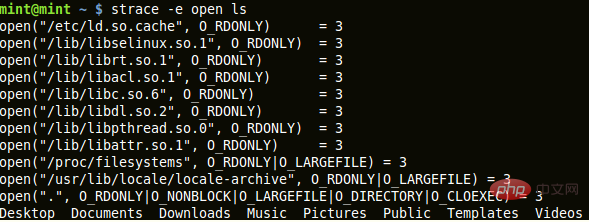
strace intercepts and records system calls and the signals they receive. To the user, it shows the system calls, the parameters passed to them, and the return values. strace can be attached to an already running process or to a new process. It is useful as a diagnostic and debugging tool for developers and system administrators.
It can also be used as a tool to understand the system by tracing different program calls. The advantage of this tool is that it does not require source code and the program does not need to be recompiled.
The basic syntax for using strace is:
strace 命令
The output of strace is very long, and we usually are not interested in every line displayed. We can use the '-e expr' option to filter unwanted data.
Use the '-p pid' option to bind to a running process.
With the '-o' option, the output of the command can be redirected to a file.

#strace filters the output of only system calls.
ltrace:
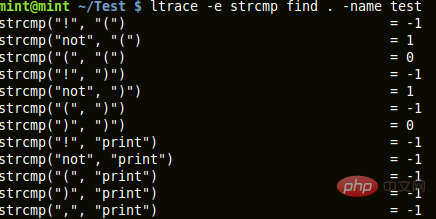
ltrace tracks and records a process's dynamic (runtime) library calls and the signals it receives. It can also track system calls made by a process. Its usage is similar to strace.
ltrace command
'-i' option prints the instruction pointer when calling the library.
'-S' option is used to capture system calls and library calls.

trace captures 'STRCMP' library calls output.
Recommended related articles and tutorials:linux tutorial
The above is the detailed content of What are the methods of program debugging in Linux?. For more information, please follow other related articles on the PHP Chinese website!