
This article mainly introduces a simple analysis of the debugging method of node.js. It has certain reference value. Now I share it with you. Friends in need can refer to it.
Refer to the debug method on the official website. First install the chrome plug-in NIM (requires scientific Internet access) and then execute the file that needs to be debugged. For example, if there is a test.js file, enter it in the terminal. node --inspect-brk test.js Then chrome will automatically create a new page for you to debug. Below are the graphic steps
(Reference article: High-efficiency PHP debugging error prompt tool: the latest version of PHPstorm Detailed explanation of xdebug configuration and use (picture))
Write something just like that
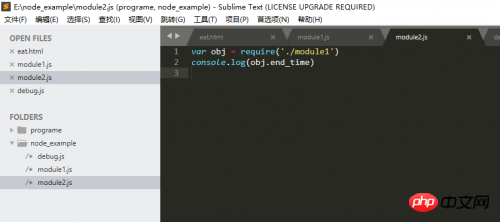
Install in the chrome app store NIM (if you cannot access it, you can search Google Access Assistant for scientific Internet access)
After the installation is completed, run the node.js file directly
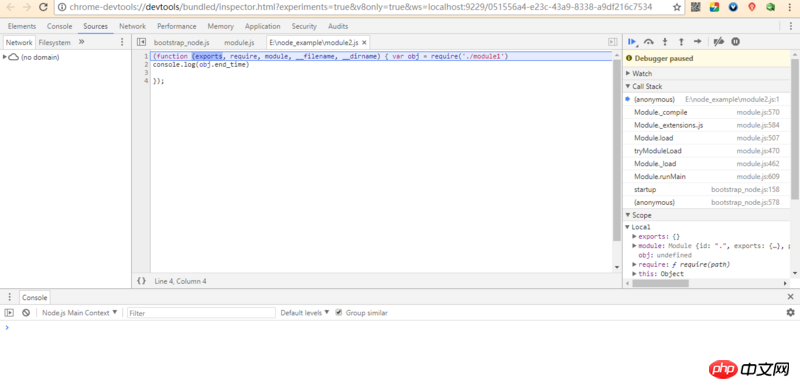
Browser A page will be automatically opened for debugging. The breakpoint debugging method is no longer described
And here you can see why each file in node.js is a separate module, and the code of each file is wrapped in in a function. You can also observe the function call stack to study node.js more deeply
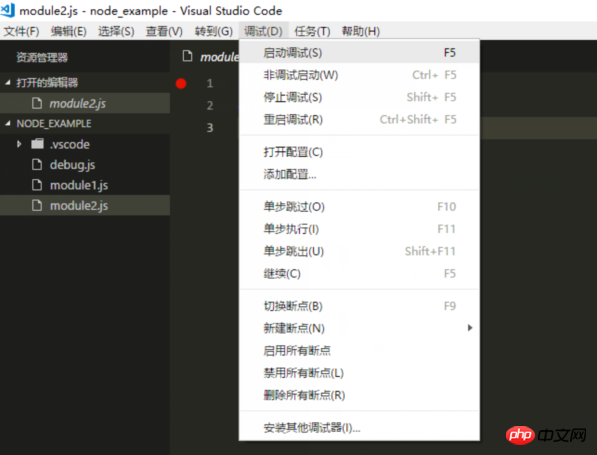
 vscode debugging
vscode is an editor from Microsoft that comes with its own debugging function. If you have not used it, download and install it. If you have used it, open vscode directly
Click the icon in the red circle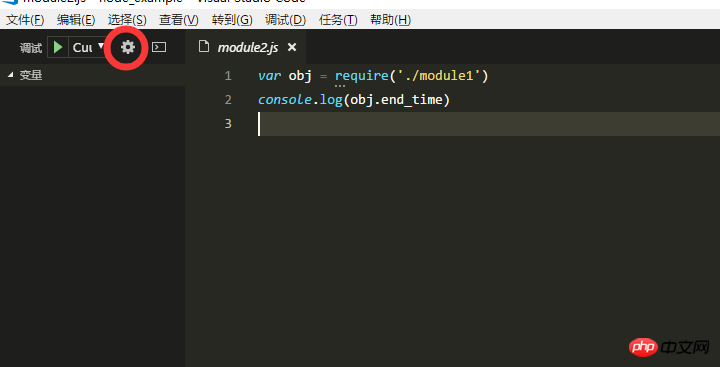
will open a json The configuration file appends a line of configuration to the object in configurations
"configurations": [
        {
            // here is somecode
            "cwd": "${cwd}"
        }
]ctrl s save
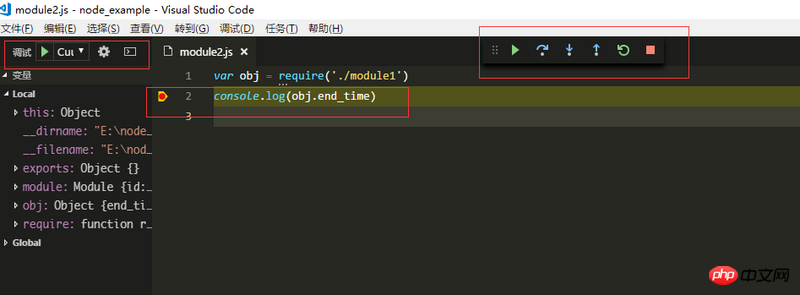
You can directly break the point on the left side of the current line of code, and then click the triangular green button in the upper left corner of the editor to start debugging . And you can step into step out like chrome for breakpoint debugging
The above is the entire content of this article. I hope it will be helpful to everyone's study. For more related content, please pay attention to the PHP Chinese website!
Related recommendations:
The above is the detailed content of A simple analysis of node.js debugging methods. For more information, please follow other related articles on the PHP Chinese website!


