

This time I will bring you the steps to implement the number of node relationships with echarts mouse overlay and highlight. What are theprecautionsfor implementing the number of node relationships with echarts mouse overlay and highlight. The following is a practical case. Let’s take a look. take a look.
This article is modified on thefocusNodeAdjacencyattribute that comes with echart.
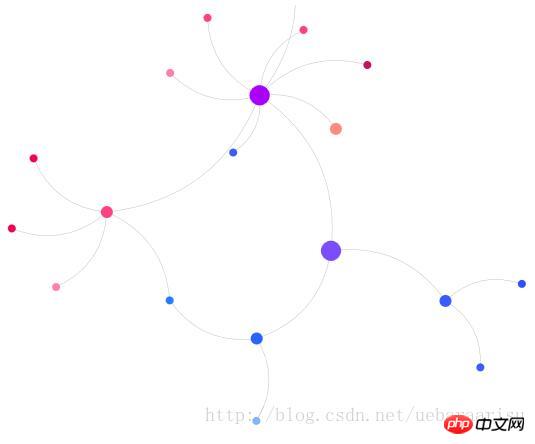
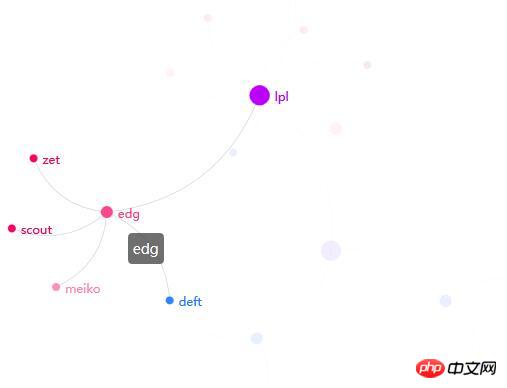
1. Effect
First apply the effect. It turns out that after the mouse overlay, only the node name is displayed but not the relationship name.
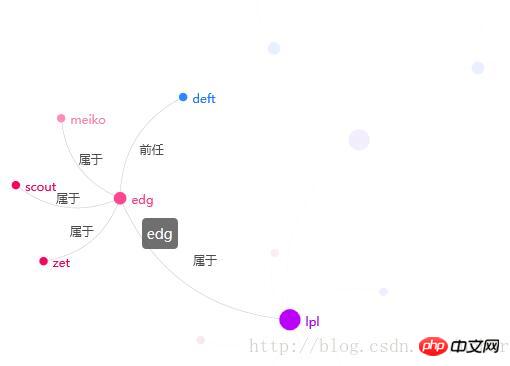
After modification, both node names and (customized) relationship names can be displayed.
2. The code
html part is like this.
js code usesjqueryand echarts.js. I use the source code version because I need to modify it in the source code later...
echarts.js download address
In fact, the js code is completely the same as the code of the echart official website demo...
For ordinary attempt settings, just add focusNodeAdjacency: true.
$(function() { showChart(); }); var myChart; option = { title : { text : '示例' }, animationDurationUpdate : 1500, animationEasingUpdate : 'quinticInOut', series : [ { type : 'graph', layout : 'force', //data和edges里的内容在之后动态添加 data : [], edges : [], //这个label管的是data的label label : { emphasis : { position : 'right', show : true } }, force : { repulsion : 1000 }, roam : true, //将指定的节点以及其所有邻接节点高亮。 focusNodeAdjacency : true, lineStyle : { normal : { width : 0.5, curveness : 0.3, opacity : 0.7 } }, draggable : true } ] }; function showChart() { myChart = echarts.init(document.getElementById('main')); myChart.showLoading(); $.ajax({ //我用struts2做了个小后台,这个url就是里面的一个action url : 'echartsDisplay', type : 'POST', data : "{}", dataType : 'json', success : function(data) { myChart.hideLoading(); //data的结构在下面有截图,可以一一对应 option.series[0].data = data.nodes.map(function(node) { return { name : node.name, itemStyle : { normal : { color : node.color } }, symbolSize : node.size, }; }); option.series[0].edges = data.links.map(function(edge) { return { source : edge.source, target : edge.target, attribute : edge.value //除了api中规定的参数,也可以使用一些自定义的参数,这里的attribute就是自定义的。这个参数在改源码时会用到。 }; }); myChart.setOption(option, true); }, error : function(errorMsg) { alert("请求数据失败!"); } }); };
The data structure and content returned by the calling interface are as follows:
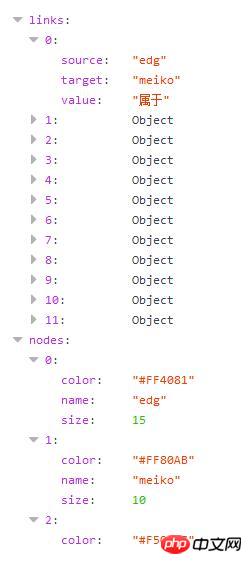
nodes represents nodes and is placed in option.series[0].data.
nodes has three parameters, color represents the color of the node, name is the name (label) of the node, and size is the size of the node.
links represent relationships and are placed in option.series[0].edges.
links has three parameters: source is the starting point of the relationship (bar), target is the end point of the relationship (bar), value is the relationship name (label), which is placed in the attribute parameter in edges.
It should be noted that to achieve this effect, the label parameter must not be set for the relationship in edges.
3. Modify the focusNodeAdjacency method in the source code
I’m ashamed because I didn’t find it in echart’s API that can directly achieve that effect. The only way to do this is to change it in the source code of echarts.
Search focusNodeAdjacency in echarts.js and you will quickly find the following content. Then just add the three lines of code withcommentsbelow to achieve the effect of displaying node and relationship names in this article. .
focusNodeAdjacency: function (seriesModel, ecModel, api, payload) { var data = this._model.getData(); var dataIndex = payload.dataIndex; var el = data.getItemGraphicEl(dataIndex); if (!el) { return; } var graph = data.graph; var dataType = el.dataType; function fadeOutItem(item, opacityPath) { var opacity = getItemOpacity(item, opacityPath); var el = item.getGraphicEl(); if (opacity == null) { opacity = 1; } el.traverse(function (child) { child.trigger('normal'); if (child.type !== 'group') { child.setStyle('opacity', opacity * 0.1); } }); } function fadeInItem(item, opacityPath) { var opacity = getItemOpacity(item, opacityPath); var el = item.getGraphicEl(); el.traverse(function (child) { child.trigger('emphasis'); /** * 如果当前child是关系,显示标签,标签内容自定。 * 使用item.getModel().get('xxx'),将xxx修改为对应的参数名称, * 可获得自带及自定义的所有内容。 * 这里get('attribute')的attribute为edge中自定义的参数。 */ if(child.type =='ec-line'){ child.setStyle('text',item.getModel().get('attribute')); } /** * 结束,这里就增加上面两句。 */ if (child.type !== 'group') { child.setStyle('opacity', opacity); } }); } if (dataIndex !== null && dataType !== 'edge') { graph.eachNode(function (node) { fadeOutItem(node, nodeOpacityPath); }); graph.eachEdge(function (edge) { fadeOutItem(edge, lineOpacityPath); }); var node = graph.getNodeByIndex(dataIndex); fadeInItem(node, nodeOpacityPath); zrUtil.each(node.edges, function (edge) { if (edge.dataIndex < 0) { return; } fadeInItem(edge, lineOpacityPath); fadeInItem(edge.node1, nodeOpacityPath); fadeInItem(edge.node2, nodeOpacityPath); }); } }, unfocusNodeAdjacency: function (seriesModel, ecModel, api, payload) { var graph = this._model.getData().graph; graph.eachNode(function (node) { var opacity = getItemOpacity(node, nodeOpacityPath); node.getGraphicEl().traverse(function (child) { child.trigger('normal'); if (child.type !== 'group') { child.setStyle('opacity', opacity); } }); }); graph.eachEdge(function (edge) { var opacity = getItemOpacity(edge, lineOpacityPath); edge.getGraphicEl().traverse(function (child) { child.trigger('normal'); if (child.type !== 'group') { child.setStyle('opacity', opacity); /** * 增加下面这一句话。 * 这个方法是鼠标从节点上移开时调用,取消高亮和标签显示的功能。 * 在这里会把关系的标签清空。 * 所以如果对关系直接设置了label的话,在这一步也会被清掉。 */ child.setStyle('text',''); } }); }); },
I believe you have mastered the method after reading the case in this article. For more exciting information, please pay attention to other related articles on the php Chinese website!
Recommended reading:
Detailed explanation of the steps for vue1 and vue2 to obtain dom elements
vue quickly copies content to the pasteboard (with code)
The above is the detailed content of Implementation steps for echarts mouse overlay and highlight node relationship number. For more information, please follow other related articles on the PHP Chinese website!


![[Web front-end] Node.js quick start](https://img.php.cn/upload/course/000/000/067/662b5d34ba7c0227.png)


