

This time I will bring you the steps to implement dynamic data display on echarts nodes. What are the precautions on how to display dynamic data on echarts nodes? The following is a practical case, let’s take a look at it together.
I just came into contact with echarts not long ago, and encountered two difficulties during use.
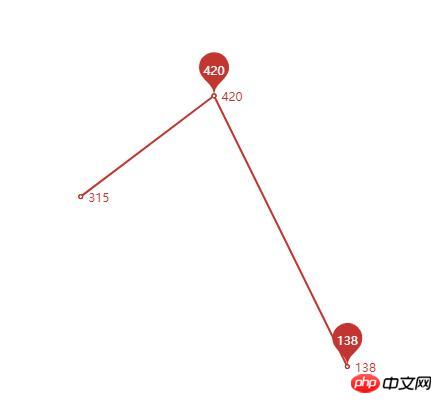
1. Each node displays dynamic data. This can actually be completed through configuration items. In the series data In binding , you can use the label formatting in the original configuration item itemStyle to complete, as follows:
The code is as follows. If you need to modify the text display style, then Additional configuration items (such as font-style, font-weigth, etc.) are required to complete
{
      name: '其中:少数民族',
      type: 'line',
      data: ssmz,
      markPoint : {
        data : [
          {type : 'max', name: '最大值'},
          {type : 'min', name: '最小值'}
        ]
      },
      itemStyle: {//节点数据显示
        normal: {
          label: {
            show: true,
            position: 'right',
            formatter: ssmz,//该值动态显示数据,若需固定的文本,则直接写入
          }
        }
      }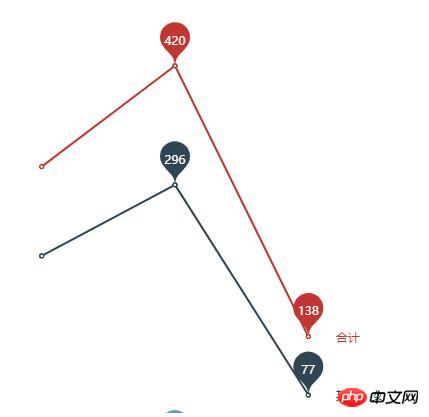
},2. Some customers will put forward other requirements. While the polyline displays the highest value and the lowest value, The meaning of the polyline needs to be added to the end of the polyline. This can also be done through itemStyle. However, when the formatter formats the text prompt, you need to write a function yourself to determine the format and then display
The code is as follows:
{
      name: '合计',
      type: 'line',
      data: hj,
      markPoint : {
        data : [
          {type : 'max', name: '最大值'},
          {type : 'min', name: '最小值'}
        ],
      },
      itemStyle: {
        normal: {
          label: {
            show: true,
            position: 'right',//居右
            offset:[20,0],//横向往右20
            formatter: function(para){//格式化提示文本
            if(para.value == hj[hj.length-1]){
            return '合计';//显示文本
            }else{
            return '';
            }
            }
          }
        }
      }
},I believe you have mastered the method after reading the case in this article. For more exciting information, please pay attention to other related articles on the php Chinese website!
Recommended reading:
Detailed explanation of the use of JS decorator functions
##vue.js element-ui implements tree structure
The above is the detailed content of echarts node displays dynamic data implementation steps. For more information, please follow other related articles on the PHP Chinese website!


![[Web front-end] Node.js quick start](https://img.php.cn/upload/course/000/000/067/662b5d34ba7c0227.png)


