How WebGL operates json and echarts charts

php中世界最好的语言
Release: 2018-03-27 13:40:36
Original
2828 people have browsed it

This time I will show you how to operate json and echarts charts with WebGL. What are theprecautions for using WebGL to operate json and echarts charts? The following is a practical case, let's take a look.

Suddenly I had an idea. If I could put some different knowledge points on the same interface and put them in a box, then if I want to see something, it can be displayed directly, and The box must be able to be opened. I used HT to realize my idea, with more than 100 lines of code. I think it is awesome that such a small amount of code can achieve this effect.

Let’s take a look at the renderings first:

The most basic thing about this example is the outermost box, so let’s take a look at how to implement it first :

var box = new ht.CSGBox(); dataModel.add(box);
Copy after login
This box can be easily implemented using HT. Many basic primitive types are encapsulated in HT. The ht.Node we often use is also one of them, so that we don’t have to write the same thing repeatedly. Code to complete the basic implementation.

The encapsulated basic primitive used in this example is ht.CSGBox, a

box model. You can refer to the HT for Web modeling manual. We can see in the manual that in In CSGBox, we can only operate all sides of the box. If you want to set some special functions yourself, you only need to operate ht.Style (HT for Web Style Manual).

To add a texture to one side of the box, the only thing I can think of is the ht.Default.setImage function encapsulated by HT.

The method I implemented here is to operate with reference to the editor of HT, re-declare a graphview component and a datamodel data model, and then call json through the ht.Default.xhrLoad method, using ht.Default in the method .parse converts the text into json format, then deserializes it to display the content in the json into a visual interface, then sets the animation, and then immediately refreshes the interface using this json. Otherwise, even if the animation is set, the screen will not change.

ht.Default.xhrLoad('displays/demo/pump.json', function(text){ const json = ht.Default.parse(text); pumpDM.deserialize(json); var currentRotation = 0; var lastTime = new Date().getTime(); setInterval(function(){ var time = new Date().getTime(); var deltaTime = time - lastTime; currentRotation += deltaTime * Math.PI / 180 * 0.3; lastTime = time; pumpDM.getDataByTag('fan1').setRotation(currentRotation); pumpDM.getDataByTag('fan2').setRotation(currentRotation); box.iv(); // g3d.iv();这边也可以刷新g3d,但是局部刷新更省 pumpGV.validateImpl(); }, 10); }, 10);
Copy after login
At this time I cannot add pumpGV and g3d to the underlying p, and my intention is to add pumpGV to one side of the CSGBox in g3d, so in order for pumpGV to be displayed, pumpGV must be set Width and height, and this width and height must be larger than the area occupied by the picture I drew in json, otherwise the display will be incomplete. If you want to see the impact of this width and height on the display, you can change it yourself and have fun.

pumpGV.getWidth = function() { return 600;} pumpGV.getHeight = function(){ return 600;} pumpGV.getCanvas().dynamic = true;//设置这个是为了让canvas能动态显示
Copy after login
The display of echarts charts is also very basic. Just add canvas.dynamic = true and refresh gv in real time.

Finally, you only need to pass the two returned canvases into ht.Default.setImage:

ht.Default.setImage('echart', charts(option)); ht.Default.setImage('pump', pumpGV.getCanvas());
Copy after login
ht.Default.drawImage function actually generates a new image. Draw pictures on canvas, so we only need to pass the canvas we have drawn to ht.Default.setImage to generate

picture.

There is one thing that needs to be improved. We can see that there is a circle of jagged edges around the line segments, graphics, and text on the box, because when we set the font, we set translucency at the same time. The "blend" style will be turned off. At this time, we cannot control the style. Generally, when there is transparency, we need to set "all.transparent" to true.

We can set the transparent of the surface that needs to be displayed. : true is enough. Take a look at the completed renderings:

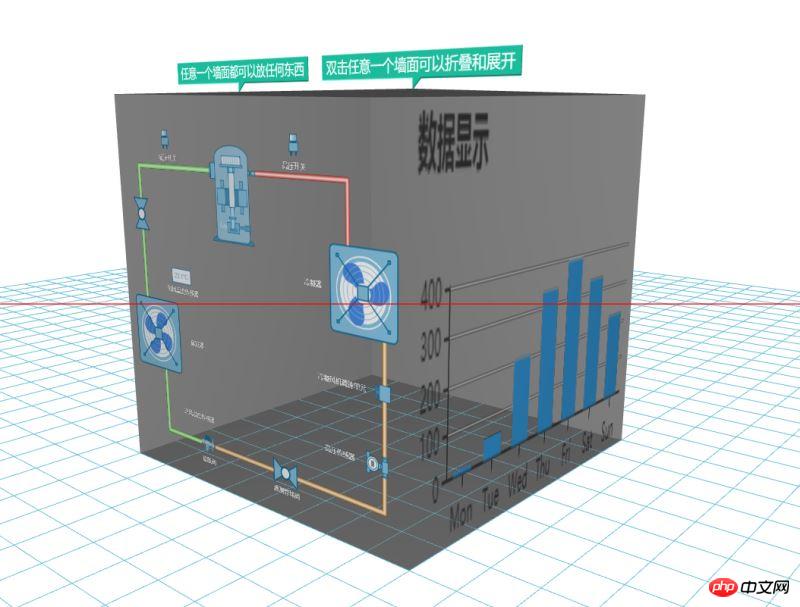
I believe you have mastered the method after reading the case in this article. Please come for more exciting information. Pay attention to other related articles on php Chinese website!

Recommended reading:

html5 How to achieve the animation effect of pictures turning in circles

How to automatically play background music in H5 videos

The above is the detailed content of How WebGL operates json and echarts charts. For more information, please follow other related articles on the PHP Chinese website!

Related labels:
source:php.cn
Statement of this Website
The content of this article is voluntarily contributed by netizens, and the copyright belongs to the original author. This site does not assume corresponding legal responsibility. If you find any content suspected of plagiarism or infringement, please contact admin@php.cn
Latest Downloads
More>
Web Effects
Website Source Code
Website Materials
Front End Template
About us Disclaimer Sitemap
php.cn:Public welfare online PHP training,Help PHP learners grow quickly!