


This article mainly shares with you the Google developer tools for js debugging. The js breakpoint function is very exciting. In the past, js code could only be debugged by the alert pop-up window in IE. Such a development environment is simply difficult for front-end programmers. A nightmare. This article introduces the specific usage of Sources to help you debug js code happily during the development process instead of going crazy because of it.
First open the F12 development tool and switch to the Sources panel
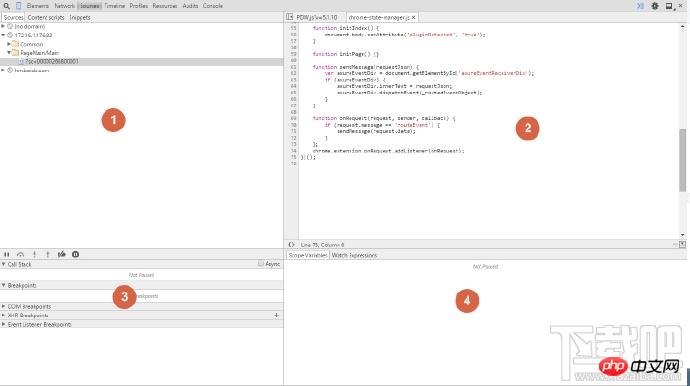
The Sources function panel is the resource panel. It is mainly divided into four parts, and the four parts are They are not independent, they are related to each other and interact together to achieve an important function: monitoring the activities of js during execution. Simply put, it is a breakpoint.
First of all, let’s look at area 1. Its function is somewhat similar to the Resources panel. It mainly displays script files loaded by web pages: such as css, js and other resource files (it does not include static resource files such as cookies and img). .
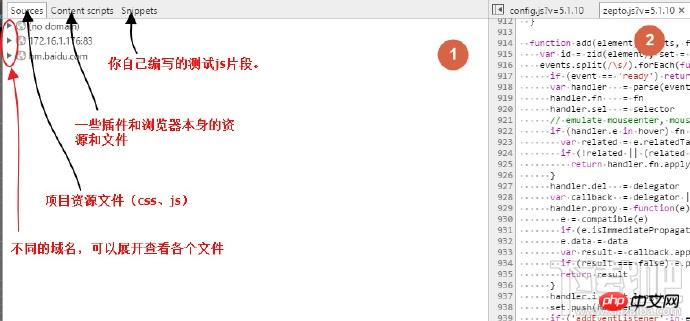
There are three tab switching options on the navigation bar of area 1. They all store js and css files under different domain names and environments. Let’s first explain Sources (resources) The role of the options:
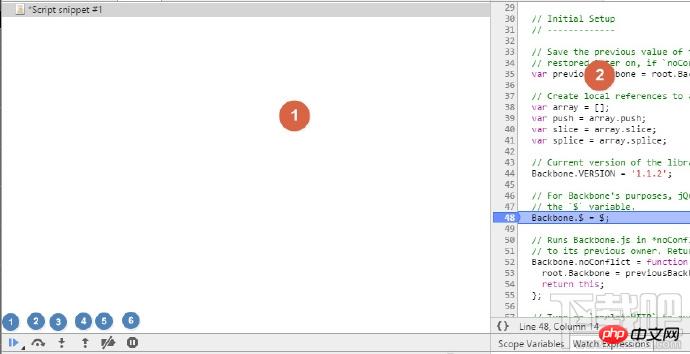
Sources: Contains the static resource files of the project. Double-click to select the file, and the content of the file will be displayed in area 2. If you select a js file, you can click the line number in area 2 for breakpoint debugging. As long as the js is executed to the line you marked, it will It will stop downward execution and wait for your command:
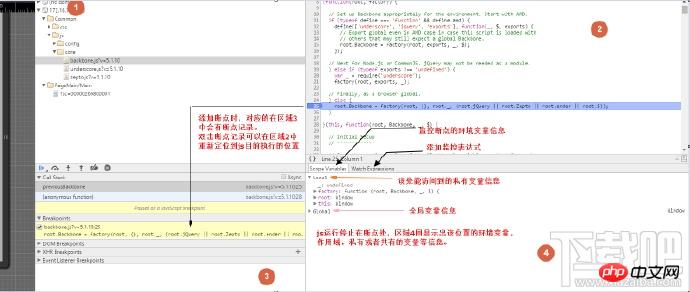
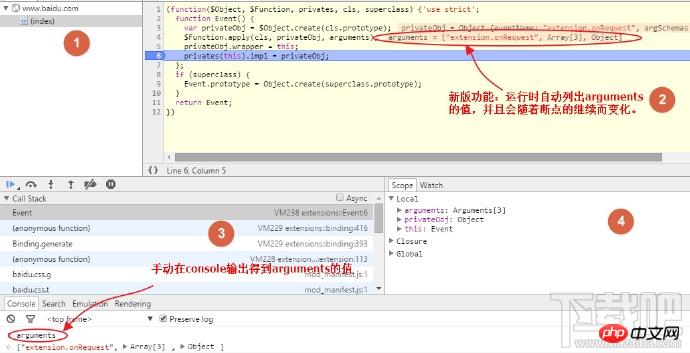
From the picture above, you can see the changes in each area when js is executed to the breakpoint, first of all, in area 3 The Breakpoints record information will be highlighted, and then the Scope option in area 4 lists the private and public variable information at the breakpoint. In this way, I can intuitively know the execution status of js at this moment. Similarly, you can put the mouse on a variable in area 2, and the browser will pop up a small box, which contains all the information about the variable you hover over:
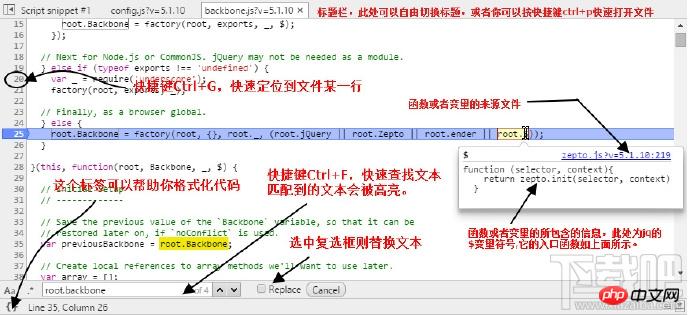
Then, you can press F10 to follow the js execution path step by step. If you encounter a function that contains another function, then you can press F11 to enter the function to observe its code execution activities. . You can also track the js code by clicking on the icons at the bottom of area 1. But I suggest you use the shortcut key, as the name suggests, because it is faster and more convenient. But how to use it depends entirely on your personal habits. The picture below shows the functions of each button.
The numbers in the blue circles in the picture above represent:
1. Stop breakpoint debugging
2. Do not jump into the function, continue to execute the next line of code (F10)
3. Jump into the function (F11)
4. Jump out of the executed function
5. Disable all breakpoints and do not do any debugging
6. Switch whether to interrupt when the program encounters an exception while running
Next, switch to the Watch Expressions option in area 4. Its function is to add an expression to the current breakpoint, so that the js code you wrote will be executed every time the breakpoint goes one step down. It should be noted that this function must be used with caution, because it may cause the monitoring code snippet you wrote to be continuously executed.
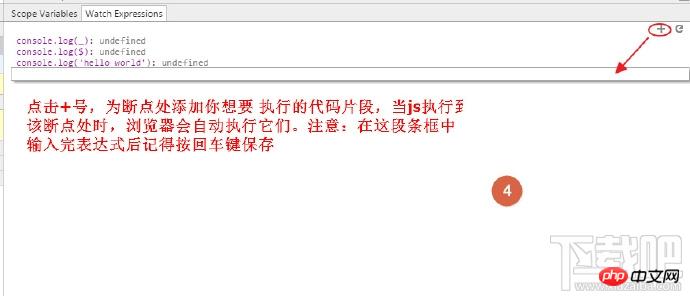
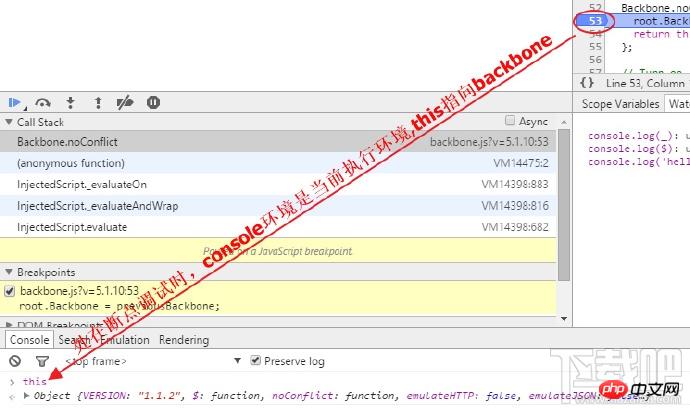
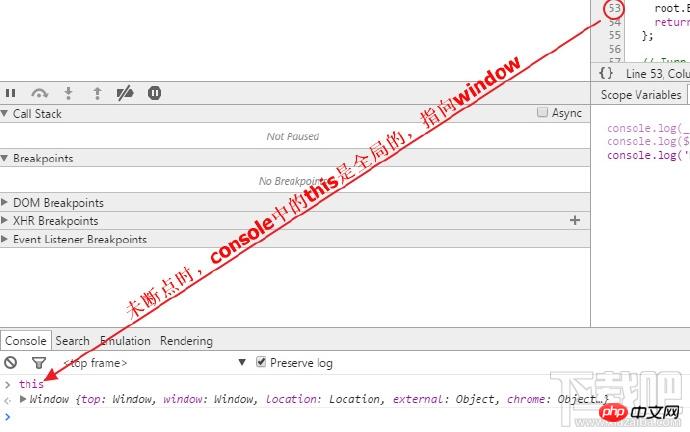
In order to avoid repeated execution of your debugging code, we can directly output the information at the current breakpoint on the console at one time during debugging (recommended) . In order to verify that what we have in the console panel is the current breakpoint environment, we can compare the changes in this value before and after the breakpoint is executed.
If you think it would be troublesome to use the console panel output to view a variable at a breakpoint, then You can update to the latest version of Chrome, which has solved this trouble for us. In order to facilitate developers' debugging, Google has gone to the extreme in this regard. After updating Chrome a few days ago, Lu Zhu accidentally discovered another way to monitor environment variables during breakpoints. This method is extremely clear. During breakpoint debugging, the value of each variable will be automatically displayed in area 2, and this value will be updated every time the code goes down. This allows developers to know the current environment variables almost at a glance. (This function has a small flaw, that is, it is impossible to view the specific index and value of the array or object, but I believe Google will improve it.)
When your project is online and a bug occurs, and you cannot see its actual online effect after you fix it, you can open the online project, modify the code directly in the browser and see Effect. This kind of effect is often the most direct. This method can also save you the trouble of frequent verification and release. After all, as a front-end coder, you will definitely have heard the complaints from the big brother in the background (usually background release). : "XXX, did you pass the test? Don't show up. It's very troublesome to publish it once!". In Chrome, you only need to modify it directly in area 2, and you can verify whether your code is feasible online. Braised here only points out one of the uses of this function. The rest is up to your ingenuity.
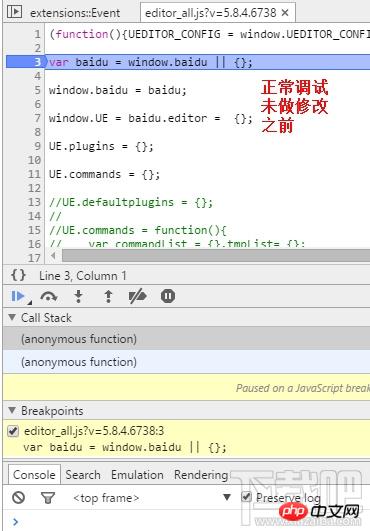
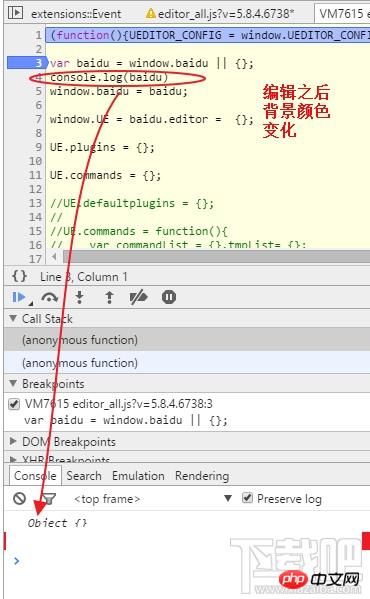
Even at breakpoint, you can edit the code. After pressing ctrl+S to save, you will see area 2 The background changes from white to light color, and the breakpoint restarts execution.
Back to area 1, the Content script option contains some third-party plug-ins or the browser's own js code. It is often ignored, and in fact it has very little effect. We can pay more attention to the Snippets option. Do you still remember the style introduced in the basics? In it, we can edit the CSS code of the interface and see their mapping effect instantly. Similarly, in Sinppets, we can also edit (rewrite) js code snippets. These fragments are actually equivalent to your js files. The difference is that the local js files are edited in the editor, but here, you write them in the browser. These code snippets will neither disappear nor execute when the browser refreshes, unless you execute it manually. It can be stored in your local browser, and even if you close the browser, it will still be there when you open it again. Its main function can make it convenient when we write the test code of some projects. You know, if you write these codes in the editor, you must add comment symbols to them or delete them manually when publishing, but in the browser Writing doesn’t need to be so cumbersome.
Right-click the blank space of the Snippets option and select the pop-up new option, create a new file of your own, and then edit it in area 2.
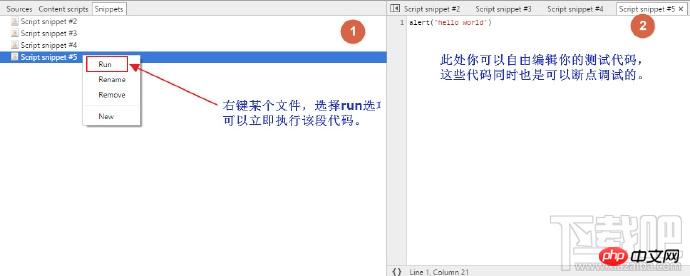
Snippets are very powerful, and many of their hidden functions have yet to be discovered. Currently, Luzhui uses it to remember debugging snippets, unit tests, and a small amount of functional code writing functions.
Finally, let’s take a look at the time-rich monitoring functions in js. As introduced in the previous article, the Sources panel has the same function of monitoring events as the Elements panel, and the functions in Sources are richer and more powerful. This part of its functionality is concentrated in area 3. Let me take the following picture as an example to observe its effect.
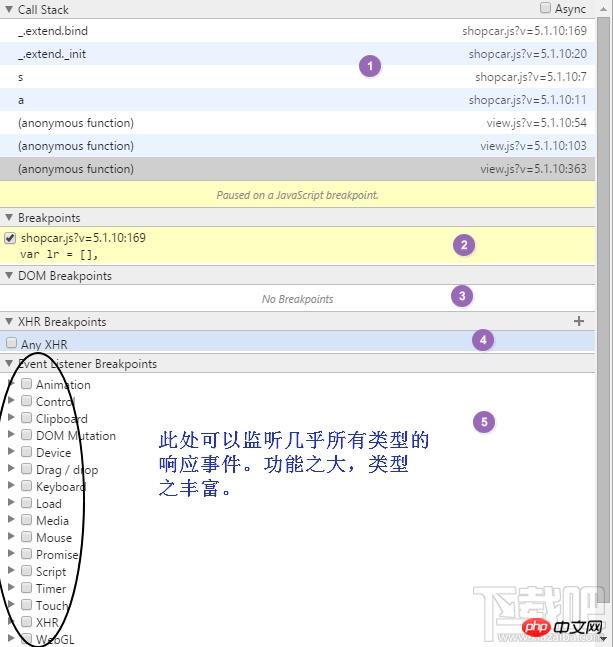
From top to bottom, the meaning of the numbers in the purple circle:
1. The debt stack at the breakpoint is starting from the function and tracing the name of the function that was called to it step by step. For example:
function a () {
   b();
}
function b() {
   c();
}
function c() {
  //在该处断点,查看call stack
}
a->b->c.
call stack 从上到下的顺序就是
c
b
a2. Your breakpoint debugging information in area 2. When a breakpoint is executed, the corresponding information will be highlighted. Double-click the information to quickly locate in area 2.
3. Added Dom monitoring information.
4. Click + and enter the string contained in the URL to monitor the Ajax request of the URL. The input content is equivalent to the URL filter. If nothing is filled in, all XHR requests will be listened to. Once the XHR call is triggered it will break at request.send().
5. Add various types of breakpoint information to web pages. For example, if an item (click) in Mouse is selected, when you initiate this action on the web page (click anywhere on the web page), your browser will immediately breakpoint to monitor the event.
It’s worth repeating again that Sources is the most commonly used and useful function panel in general function development. Many of its functions are very helpful for us to develop front-end projects. In today's web2.0 era, I do not recommend still writing debugging information in your own code, because this will make your development cumbersome. We should make good use of the powerful functions provided by Chrome development tools. This article ends here. Although it is a bit cumbersome, it finally basically expresses the experience and ideas of using braised pork. I hope it will be helpful to you. If you think it’s good, please recommend this article and continue to follow Lu Zhuzai’s blog. In the next article, I will introduce you to performance debugging in Chrome development tools.
Related recommendations:
What are the js debugging methods
5 essential debugging skills for JS debugging_javascript skills
JS debugging in JavaScript programming_javascript skills
The above is the detailed content of js debugging google developer tools. For more information, please follow other related articles on the PHP Chinese website!


![[Web front-end] Node.js quick start](https://img.php.cn/upload/course/000/000/067/662b5d34ba7c0227.png)


