


This article mainly shares with you the method of phpstorm+xdebug to implement breakpoint debugging of PHP. I hope it can help you.
xdebug download address: https://xdebug.org/download.php
Note: "ts" means thread-safe, and "nts" is not marked. That is to say, if you want to download an unmarked file of nts, the downloaded file name is actually marked.
Copy the downloaded dll to the ext folder in php (the extension dlls are all here), and rename it to php_xdebug.dll.
Modify in php.ini (add under "; Module Settings;"):
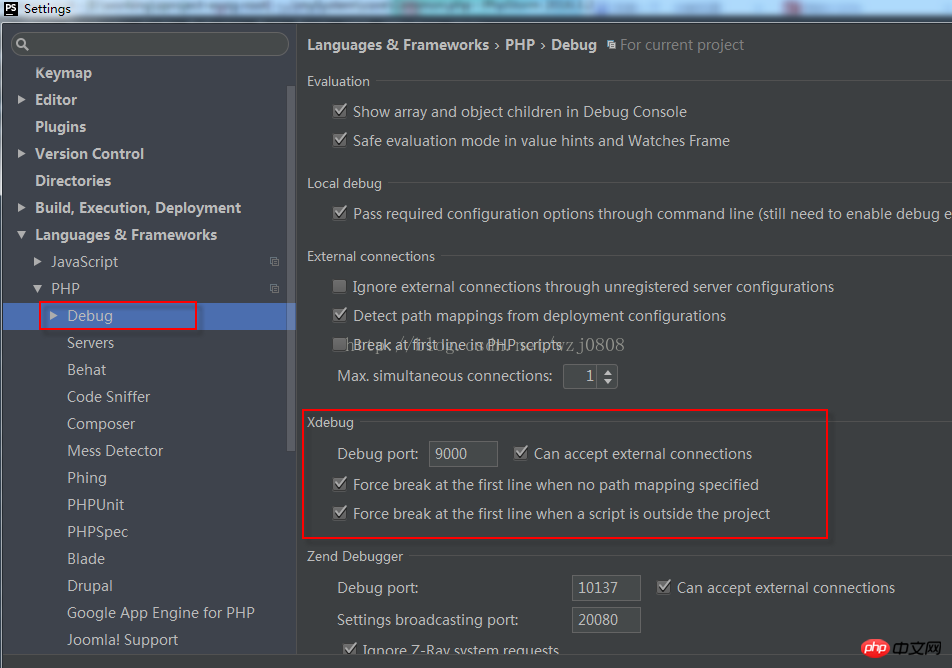
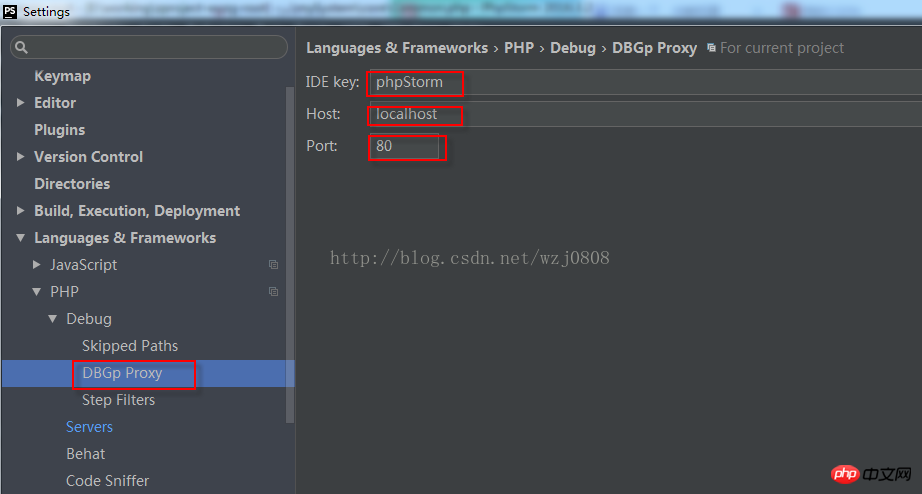
[xdebug] zend_extension=php_xdebug.dll xdebug.remote_enable = On xdebug.remote_handler = dbgp xdebug.remote_host= localhost xdebug.remote_port = 9000 xdebug.idekey = PHPSTORM
View on the phpinfo page , there will be xdebug related information, indicating that php has been configured!

 ##Related recommendations:
The above is the detailed content of phpstorm+xdebug implements breakpoint debugging of php. For more information, please follow other related articles on the PHP Chinese website!


![[Web front-end] Node.js quick start](https://img.php.cn/upload/course/000/000/067/662b5d34ba7c0227.png)


