Use Python to crawl the entire process of a Taobao product, mine and analyze the product data, and finally draw a conclusion.

Project content
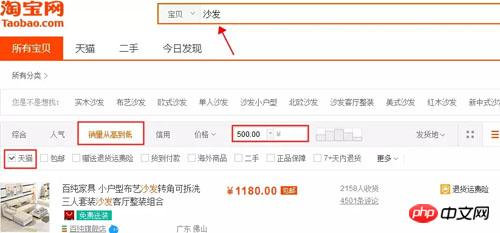
In this case, the product category is selected: sofa.
Quantity: 100 pages, 4400 products in total.
Filter conditions: Tmall, sales volume from high to low, price above 500 yuan.
Project Purpose
Conduct text analysis on product titles and word cloud visualization
Statistical analysis of sales corresponding to different keyword words
Price distribution of products Situation analysis
Sales distribution analysis of commodities
Average sales distribution of commodities in different price ranges
Analysis of the impact of commodity prices on sales
Commodity prices Analysis of the impact on sales
Distribution of product quantity in different provinces or cities
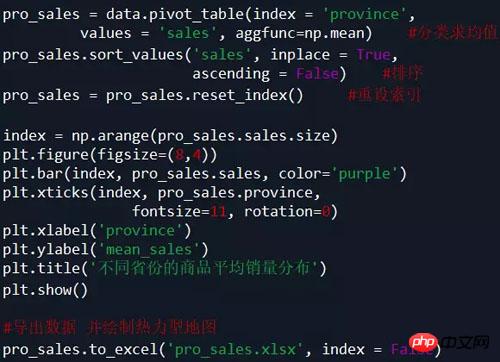
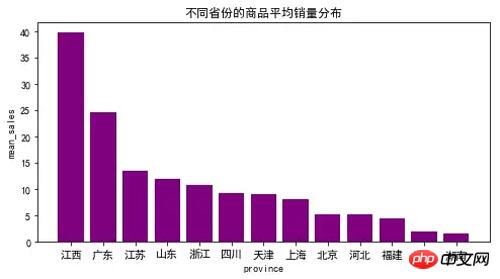
Average sales distribution of products in different provinces
Note: This project only uses the above analysis as the basis example.
Project steps
Data collection: Python crawls Taobao product data
Clean and process the data
Text analysis: jieba word segmentation, wordcloud visualization
Data histogram visualization: barh
Data histogram visualization: hist
Data scatter plot visualization: scatter
Data regression analysis visualization: regplot
Tools & Modules
Tools: Spyder of Anaconda, the code editing tool in this case.
Modules: requests, retrying, missingno, jieba, matplotlib, wordcloud, imread, seaborn, etc.
Crawling data
Because Taobao is anti-crawler, although it uses multi-threading and modifies the headers parameters, it still cannot guarantee 100% crawling every time, so I added a loop crawling , crawling unsuccessful pages each time in a loop until all pages are successfully crawled.
Note: The Taobao product page is in JSON format, and regular expressions are used for parsing here.
The code is as follows:

Data cleaning and processing
Data cleaning and processing steps can also be completed in Excel and then read in data.
The code is as follows:
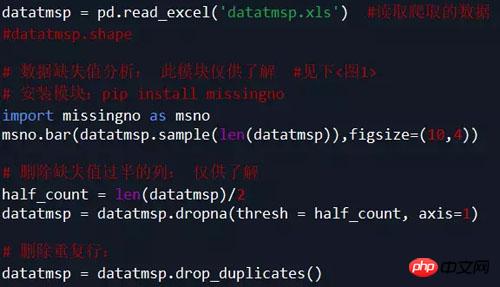
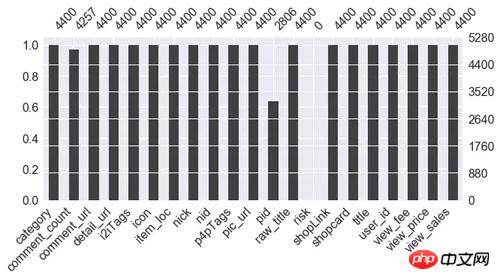
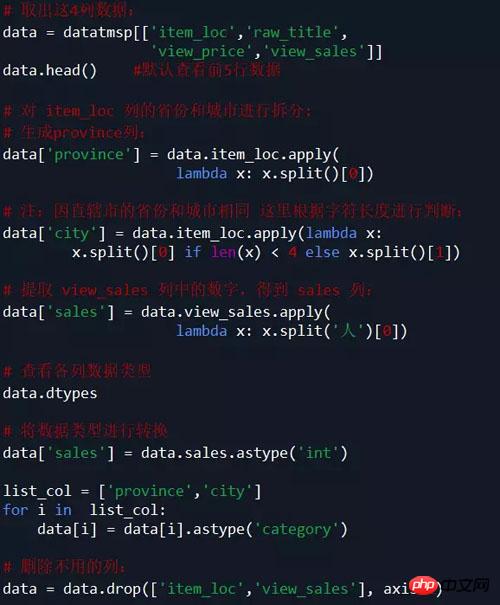
Description: According to the requirements, in this case only item_loc, raw_title, view_price, The four columns of data in view_sales mainly analyze region, title, price, and sales volume.
The code is as follows:
Data Mining and Analysis
Perform text analysis on the raw_title column title
Use stuttering word segmentation Tool, install the module pip install jieba:

Filter the elements (str) of each list in title_s (list of list format) and remove unnecessary words. That is, all the words in the stopwords list are removed:
#Because the number of each word is counted below, for the sake of accuracy, here is the filtered Each list element in the data title_clean is deduplicated, that is, each title is divided into unique words.
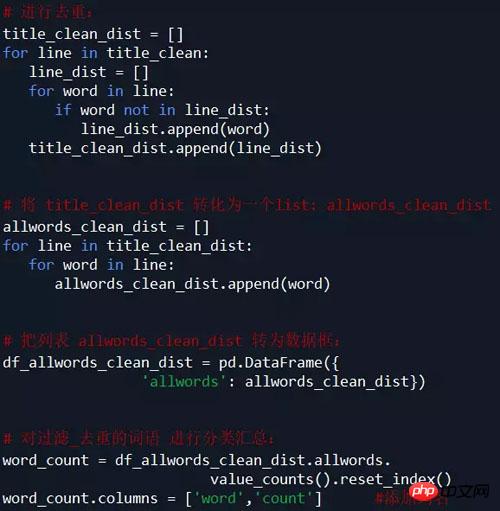
#Observing the words in the word_count table, we found that jieba's default dictionary cannot meet the needs.
Some words (such as removable, non-removable, etc.) are cut. Here, new words are added to the dictionary according to the needs (you can also add or delete directly in the dictionary dict.txt, and then load the modified dict. txt).
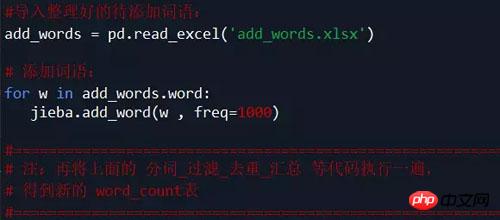
#Word cloud visualization requires the wordcloud module to be installed.
There are two ways to install the module:
pip install wordcloud
Download Packages installation: pip install package name
Note: Please download the software The package is placed in the Python installation path.
The code is as follows:
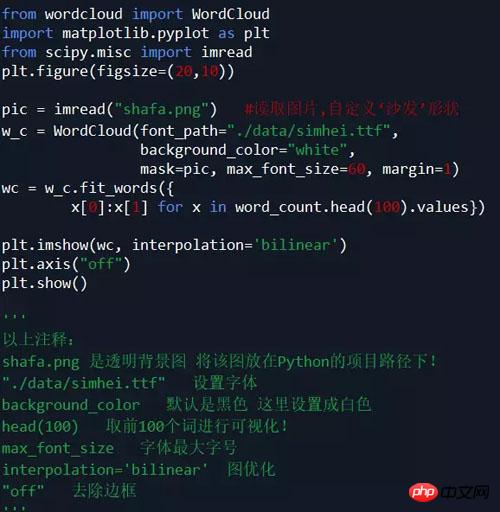
Analytical conclusion:
Combined and complete products account for a large proportion high.
Looking at the sofa material: Fabric sofas account for a high proportion, more than leather sofas.
Looking at sofa styles: simple style is the most popular, followed by Nordic style, and other styles are ranked in order: American, Chinese, Japanese, French, etc.
Looking at house types: small houses account for the highest proportion, followed by large and small houses, and large houses the least.
Statistical analysis of the sum of sales corresponding to different keyword words
Explanation: For example, with the word "simplistic", the sum of sales of products containing the word "simplistic" in the product title will be counted. That is, find the sum of sales of products with a "simple" style.
The code is as follows:
Visualize the data in the word and w_s_sum columns in the table df_word_sum. (In this example, the top 30 sales words are used for drawing)
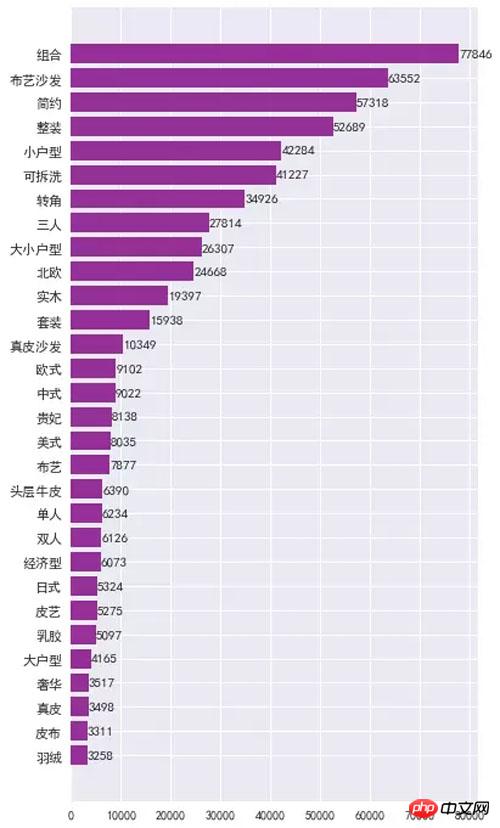
It can be seen from the chart:
combination products The highest sales volume.
From a category perspective: Fabric sofa sales are very high, far exceeding leather sofas.
Looking at apartment types: sales of sofas are highest in small apartments, followed by large and small apartments, and sales in large apartments are the least.
In terms of style: simple style has the highest sales volume, followed by Nordic style, followed by Chinese style, American style, Japanese style, etc.
Removable and washable and corner sofas have considerable sales volume and are also very popular among consumers.
Analysis of price distribution of commodities
The analysis found that some values are too large. In order to make the visualization effect more intuitive, here we combine our own product conditions and select commodities with a price less than 20,000.
The code is as follows:

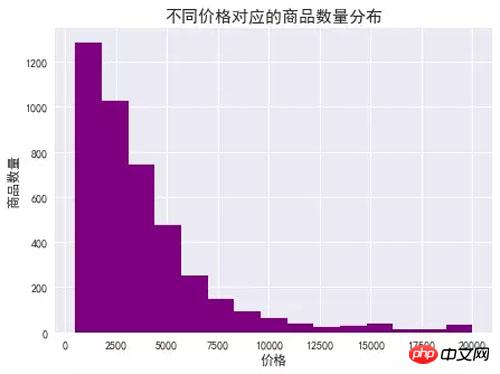
It can be seen from the chart:
The quantity of goods is generally displayed with the price In the descending ladder situation, the higher the price, the fewer goods are on sale.
There are mostly low-priced products, with the most products priced between 500-1500, followed by those between 1500-3000, and less products priced above 10,000.
There is not much difference in the number of products on sale for products with a price of more than 10,000 yuan.
Sales distribution analysis of goods
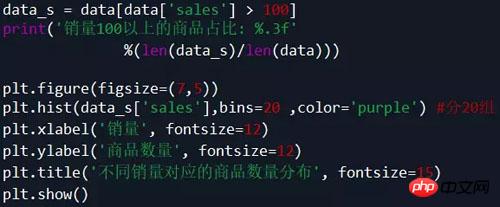
Similarly, in order to make the visualization more intuitive, here we choose the sales volume to be greater than 100's of merchandise.
The code is as follows:
It can be seen from the chart and data:
Only 3.4% of the products have a sales volume of more than 100, among which the products with a sales volume of 100-200 are the most, and 200- The next best between 300.
Sales between 100-500, the number of products shows a downward trend with sales, and the trend is steep, with mostly low-selling products.
There are very few products with sales of more than 500.
The average sales volume distribution of goods in different price ranges
The code is as follows:
From the chart It can be seen that:
The average sales volume of products with prices between 1331-1680 yuan is the highest, followed by those with prices between 951-1331 yuan, and those with prices above 9684 yuan are the lowest.
The overall trend is to increase first and then decrease, but the highest peak is at a relatively low price stage.
It shows that consumers’ demand for sofas is more at the low price stage. The higher the price above 1,680 yuan, the smaller the average sales volume is.
Analysis of the impact of commodity prices on sales
Same as above, in order to make the visualization effect more intuitive, here we combine our own product conditions and select products with a price less than 20,000.
The code is as follows:

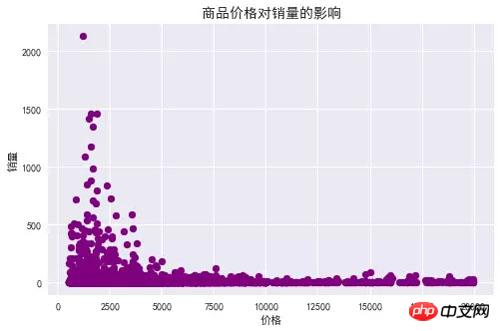
It can be seen from the chart:
The overall trend: with the price of goods increases, its sales volume decreases, and commodity prices have a great impact on its sales volume.
The sales volume of a few products priced between 500-2500 is very high. The sales volume of most products priced between 2500-5000 is low, and a few products are relatively high. However, the sales volume of products priced above 5000 are very low. There are no products with outstanding sales.
Analysis of the impact of commodity prices on sales
The code is as follows:
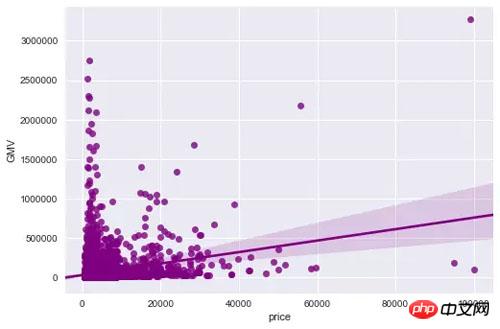
It can be seen from the chart :
Overall trend: It can be seen from the linear regression fitting line that product sales show an upward trend with price growth.
The prices of most products are on the low side and sales are also on the low side.
Only a few products with prices ranging from 0 to 20,000 have high sales. Only 3 products with prices from 20,000 to 60,000 have high sales. One product with prices from 60,000 to 100,000 has high sales, and it is the largest one. value.
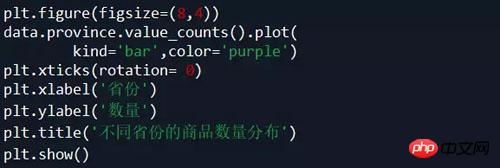
The distribution of commodity quantity in different provinces
The codes are as follows:
 ##Thermodynamic map


