


This article mainly introduces the Node Inspector proxy implementation. The editor thinks it is quite good. Now I will share it with you and give it as a reference. Let’s follow the editor to take a look, I hope it can help everyone.
Background
When doing node development, breakpoint debugging through node inspector is a very common debugging method. However, there are several problems that will reduce our debugging efficiency.
Question 1: When using vscode for breakpoint debugging, if the application starts the inspector through the cluster, then every time the worker hangs and restarts, the inspector's port will increase automatically. Although the inspectPort fixed debugging port can be specified in the node8.x version, it is not supported in node6.x. This will cause the debugging port to be respecified in vscode every time the worker is restarted.
Question 2: When using devtools for debugging, you need to copy the devtools link to chrome for debugging every time. The port change problem mentioned above will cause the devtools link to change. In addition, every time Restarting the inspector will also cause the devtools link to change because the websocket id has changed.
Simplifying the above two problems is:
Debug in vscode, and you can reconnect after the inspector port is changed or the websocket id is changed.
Debug in devtools and you can reconnect after the inspector port is changed or the websocket id is changed.
Solution
There is currently a solution in the industry which is the chrome plug-in Node Inspector Manager (Nim), but this can only solve the problem of application restart under the same inspector port. The problem of post-link changes cannot solve the problem of self-increment of ports caused by cluster startup, unless multiple ports are specified in Nim in advance. Furthermore, Nim is a plug-in on chrome and cannot do anything for debugging in vscode.
So the best solution is naturally to use node as the inspector agent. The solution is as follows:
For the first problem, on vscode, it will call the /json interface by itself Get the latest websocket id, and then use the new websocket id to connect to the node inspector service. Therefore, the solution is to implement a tcp proxy function for data forwarding.
For the second question, since devtools will not automatically obtain the new websocket id, we need to do dynamic replacement, so the solution is to use the proxy service to get the websocket id from /json, and then shake hands with the websocket When the websocket id is dynamically replaced in the request header.
Drawed a flow chart:
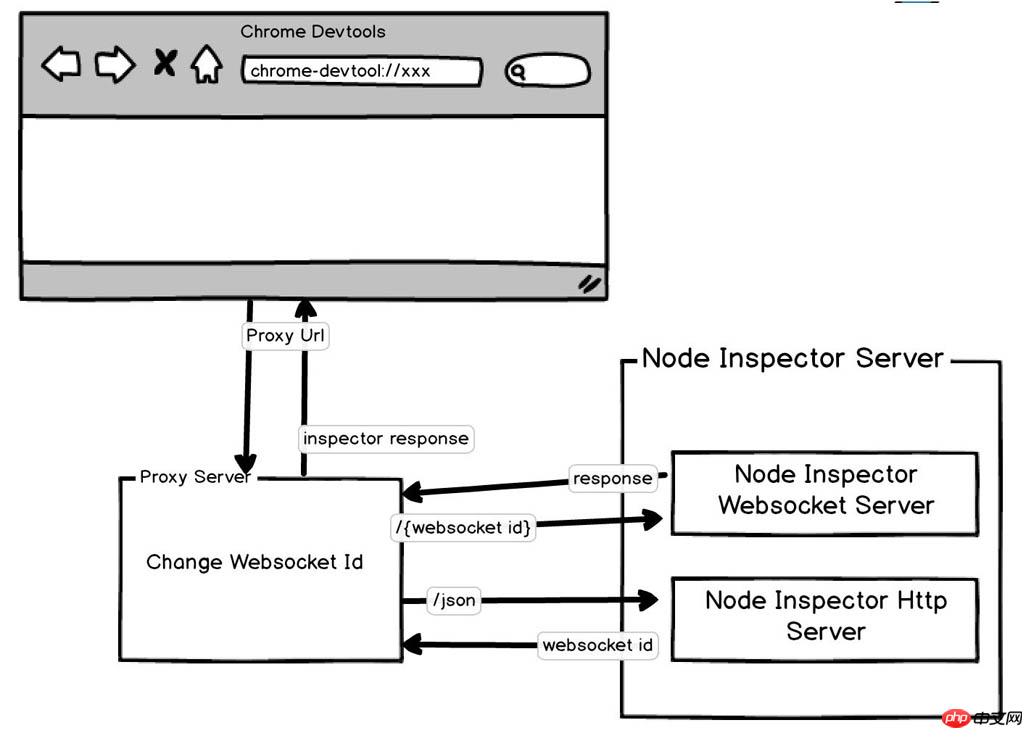
Implementation steps
1. Tcp proxy
First, implement The function of a tcp proxy is actually very simple. It is to create a Tcp Server for the proxy port through the node's net module, and then when there is a connection, create a connection to the target port, and then the data can be forwarded. .
The simple implementation is as follows:
const net = require('net'); const proxyPort = 9229; const forwardPort = 5858; net.createServer(client => { const server = net.connect({ host: '127.0.0.1', port: forwardPort, }, () => { client.pipe(server).pipe(client); }); // 如果真要应用到业务中,还得监听一下错误/关闭事件,在连接关闭时即时销毁创建的 socket。 }).listen(proxyPort);
The above implements a relatively simple proxy service, which connects the data of the two services through the pipe method. When the client has data, it will be forwarded to the server, and when the server has data, it will also be forwarded to the client.
After completing this Tcp proxy function, the debugging requirements of vscode can be realized. Specify the port as the proxy port in launch.json under the project in vscode, and add the configuration in configurations
{ "type": "node", "request": "attach", "name": "Attach", "protocol": "inspector", "restart": true, "port": 9229 }
Then when the application is restarted or the inspect port is changed, vscode can automatically reattach to your application through the proxy port.
2. Obtain websocketId
This step begins to solve the problem of being able to reattach when the devtools link remains unchanged. When starting the node inspector server, the inspector service also provides A /json http interface is used to obtain the websocket id.
This is quite simple. Just send an http request to /json of the target port and you can get the data:
[ { description: 'node.js instance', devtoolsFrontendUrl: '...', faviconUrl: 'https://nodejs.org/static/favicon.ico', id: 'e7ef6313-1ce0-4b07-b690-d3cf5274d8b0', title: '/Users/wanghx/Workspace/larva-team/vscode-log/index.js', type: 'node', url: 'file:///Users/wanghx/Workspace/larva-team/vscode-log/index.js', webSocketDebuggerUrl: 'ws://127.0.0.1:5858/e7ef6313-1ce0-4b07-b690-d3cf5274d8b0' } ]
The id field in the above data is the websocket we need id.
3. Inspector proxy
After getting the websocket id, you can dynamically replace the websocket id in the tcp proxy. First we need a fixed link, so first set a proxy link, such as My proxy service port is 9229, then the proxy link of chrome devtools is:
chrome-devtools://devtools/bundled/inspector.html?experiments=true&v8only=true&ws=127.0.0.1:9229/__ws_proxy__
Except for the last ws=127.0.0.1:9229/__ws_proxy__, the others are fixed, and the last one can be seen at a glance as a websocket link. Among them, __ws_proxy__ is used as a placeholder. When chrome devtools initiates a websocket handshake request to this proxy link, it replaces __ws_proxy__ with the websocket id and then forwards it to the node's inspector service.
Just make some minor modifications to the pipe logic code in the above tcp proxy.
const through = require('through2'); ... client .pipe(through.obj((chunk, enc, done) => { if (chunk[0] === 0x47 && chunk[1] === 0x45 && chunk[2] === 0x54) { const content = chunk.toString(); if (content.includes('__ws_proxy__')) { return done(null, Buffer.from(content.replace('__ws_proxy__', websocketId))); } } done(null, chunk); })) .pipe(server) .pipe(client); ...
Create a transform stream through through2 to make changes to the transmitted data.
简单判断一下 chunk 的头三个字节是否为GET,如果是 GET 说明这可能是个 http 请求,也就可能是 websocket 的协议升级请求。把请求头打印出来就是这个样子的:
GET /__ws_proxy__ HTTP/1.1 Host: 127.0.0.1:9229 Connection: Upgrade Pragma: no-cache Cache-Control: no-cache Upgrade: websocket Origin: chrome-devtools://devtools Sec-WebSocket-Version: 13 ...
然后将其中的路径/__ws_proxy替换成对应的 websocketId,然后转发到 node 的 inspector server 上,即可完成 websocket 的握手,接下来的 websocket 通信就不需要对数据做处理,直接转发即可。
接下来就算各种重启应用,或者更换 inspector 的端口,都不需要更换 debug 链接,只需要再 inspector server 重启的时候,在下图的弹窗中
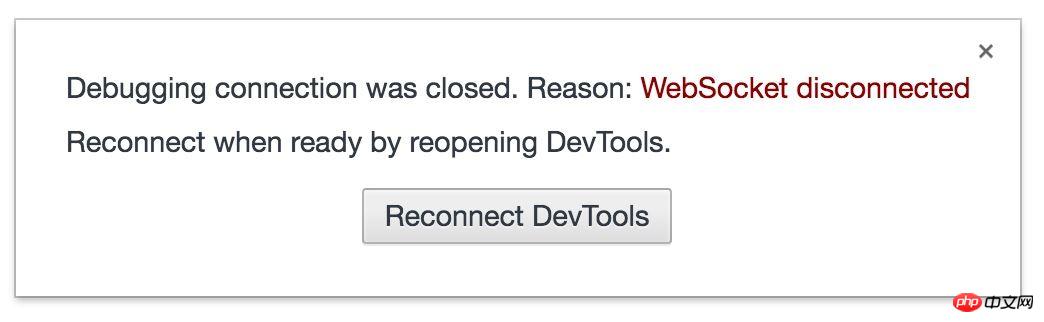
点击一下 Reconnect DevTools 即可恢复 debug。
相关推荐:
Web Inspector:关于在 Sublime Text 中调试Js的介绍_基础知识
The above is the detailed content of Node Inspector agent implementation example tutorial. For more information, please follow other related articles on the PHP Chinese website!
 How to use Java switch
 Why does wifi have an exclamation mark?
 Which one is better, vivox100 or vivox100pro?
 How to register for corporate Alipay
 How to turn on and off Douyin Xiaohuoren
 How to write triangle in css
 The difference between MATE60 and MATE60PRO
 How to recover accidentally deleted files


![[Web front-end] Node.js quick start](https://img.php.cn/upload/course/000/000/067/662b5d34ba7c0227.png)


