This article mainly introduces the implementation code of PHP using Echarts to generate data statistical reports. Friends who need it can refer to it. I hope it can help everyone.
echarts statistics, simple example
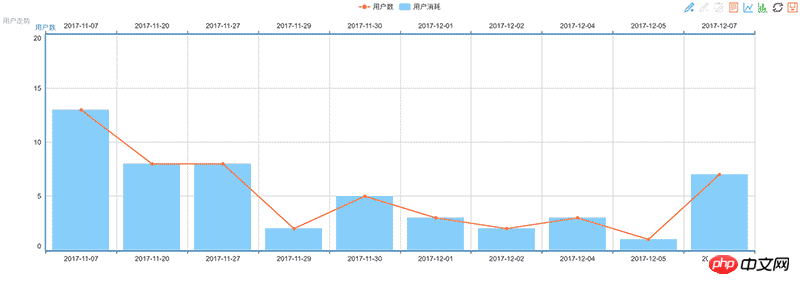
Look at the renderings first

//折线统计 public function getRes(){ $user = M('account'); $sql = "SELECT date(createTime) AS date,count(*) as count FROM t_account GROUP BY date "; $result = $user->query($sql); $this->ajaxReturn(array('code'=>200,'result'=>$result)); }
Detailed explanation of the correct posture of using Echarts in React components
HTML5, JS, JQuery, ECharts asynchronous loading
ECharts3 implements the operation of dynamic data + time axis
The above is the detailed content of Detailed explanation of using Echarts to generate statistical reports with PHP. For more information, please follow other related articles on the PHP Chinese website!


