


We generally use the debugging tools that come with Chrome or Firefox when debugging Javascript. This article lists several tips for debugging Javascript. Mastering them will allow us to spend less time solving errors and bugs, thereby improving Development efficiency. This article mainly introduces 9 techniques for debugging JavaScript using Chrome Firefox’s built-in web debugging tools. I hope it can help everyone.
1. debugger
In addition to console.log, debugger is our favorite and fast debugging tool. After executing the code, Chrome will automatically stop while executing. You can even encapsulate it into a conditional and only run it when needed.
if (thisThing) { debugger; }
2. Display objects in a table
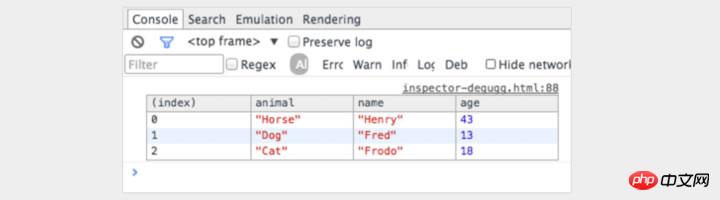
Sometimes, there is a complex set of objects to view. You can view and scroll through console.log, or use console.table to expand it, making it easier to see what is being processed!
var animals = [ { animal: 'Horse', name: 'Henry', age: 43 }, { animal: 'Dog', name: 'Fred', age: 13 }, { animal: 'Cat', name: 'Frodo', age: 18 } ]; console.table(animals);
3. Use different screen sizes
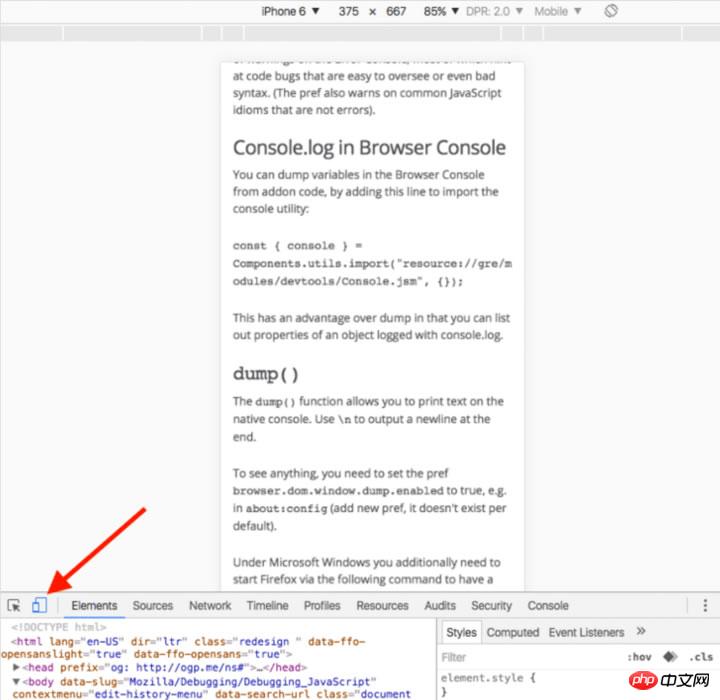
It is very easy to install different mobile device emulators on the desktop Great, but realistically it's not feasible. How to adjust the window size? Chrome provides everything you need. Jump to the console and click on the 'Switch device mode' button. Just observe the window changes!
4. Use console.time() and console.timeEnd() to test the loop
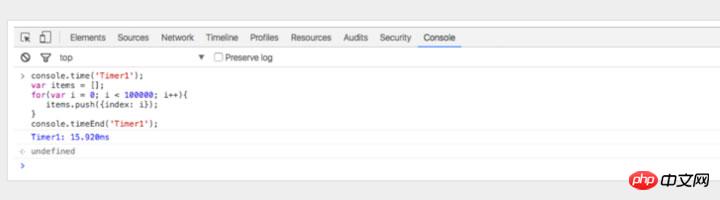
To know the behavior of certain codes Execution times are useful, especially when debugging slow loops. You can even set multiple timers by passing different parameters to the method. Let’s see how it runs:
console.time('Timer1'); var items = []; for(var i = 0; i < 100000; i++){ items.push({index: i}); } console.timeEnd('Timer1');
The operation produces the following results:
5. Change the code Debugging JavaScript after formatting
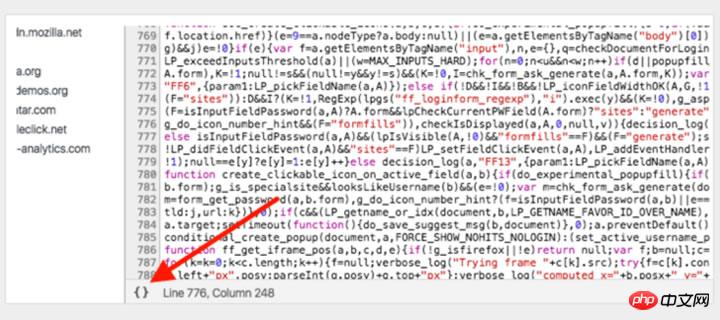
Sometimes the code will have problems in the production environment, but your source maps are not deployed in the production environment. do not be afraid. Chrome can format your JavaScript files. The formatted code isn't as useful as the real code, but at least you can see what's going on. Just click the {} button in the source code viewer in the Chrome console.
6. Observe the calls and parameters of specific functions
In the Chrome console, you can observe specific functions. Each time this function is called, the parameters passed in will be printed out.
var func1 = function(x, y, z) { //.... };
Output:
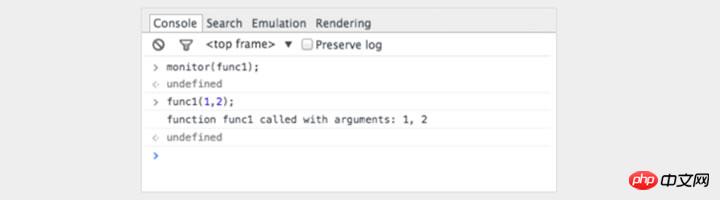
This is a good way to see the parameters passed into the function. However, it would be better if the console prompts us for the number of formal parameters. In the above example, func1 expects 3 parameters, but only 2 parameters are passed in. If this parameter is not handled in the code, errors are likely to occur.
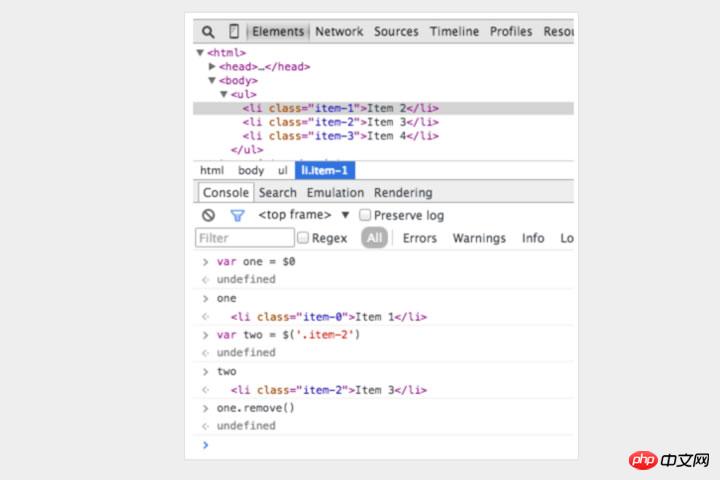
7. Quickly access elements in the console
A faster method than querySelector in the console is to use the dollar sign, $('css-selector') will return the first CSS selector matches. $$('css-selector') will return all matches. If you use an element multiple times, you can save it as a variable.
8. Postman is great (but Firefox is faster)
Many developers use Postman to view ajax requests. Postman is really great. But opening a new window, writing request objects, and then testing them is cumbersome.
Sometimes it's easier to use a browser.
When you use a browser to view, if you request a password verification page, there is no need to worry about the authentication cookie. See below how to edit and resend the request in Firefox.
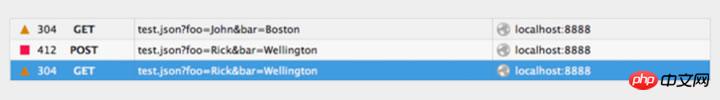
Open the console and switch to the network tab. Right-click the desired request and select Edit and Resend. Now you can change whatever you want. Change the title and edit the parameters, then click Resend.
Below are two requests I initiated with different attributes:
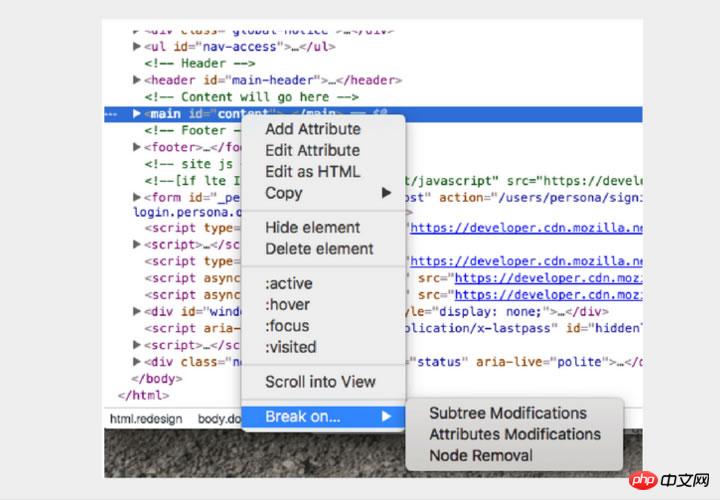
9. Interrupting node changes
DOM is an interesting thing . Sometimes it changes and you don't know why. However, when you debug JavaScript, Chrome can pause when DOM elements change. You can even monitor its properties. In the Chrome console, right-click the element and select Break in Settings:
The web debugging tools that come with Chrome and Firefox are very powerful, and there are many very practical little functions waiting for everyone to discover.
Related recommendations:
Example of how to debug JavaScript in Chrome
Code to add an output window for debugging JavaScript_javascript tips
Problems encountered in debugging regular expressions in JavaScript_javascript skills
The above is the detailed content of 9 tips for debugging JavaScript using Chrome Firefox's built-in debugging tools. For more information, please follow other related articles on the PHP Chinese website!


![[Web front-end] Node.js quick start](https://img.php.cn/upload/course/000/000/067/662b5d34ba7c0227.png)


