

Pages should not only load quickly, but also run smoothly; scrolling should be as fast as the swipe of a finger, and animations and interactions should be as smooth as silk.
Currently the screen refresh rate of most devices is 60 times/ Second. Therefore, if there is an animation or gradient effect in the page, or the user is scrolling the page, the rate at which the browser renders each frame of the animation or page needs to be consistent with the refresh rate of the device screen.
The budgeted time per frame is just over 16 milliseconds (1 second / 60 = 16.66 milliseconds). But in reality, the browser has some finishing work to do, so all the work needs to be completed within 10 milliseconds . If this budget cannot be met, framerates will drop and content will have judders on the screen. This phenomenon is often called jank(jank) and will have a negative impact on the user experience.
The pixel pipeline
There are five main areas to understand and pay attention to as you work. These are the parts that have the most control and are key points in the pixel-to-screen pipeline:

JavaScript. Generally speaking, JavaScript is used to achieve some visual changes. For example, use jQuery's animate function to create an animation, sort a data set, or add some DOM elements to the page. In addition to JavaScript, there are other common methods to achieve visual changes, such as CSS Animations, Transitions, and Web Animation API.
Style calculationsSytle calculations. This is the process of figuring out which CSS rules apply to which elements based on matching selectors, for example, .headline or .nav > .nav__item. From there, once rules are known, they are applied and the final styles for each element are calculated.
LAYOUT. After knowing which rules apply to an element, the browser can begin to calculate how much space it will occupy and its position on the screen. The layout mode of a web page means that one element may affect other elements. For example, the width of the
element generally affects the width of its child elements and nodes everywhere in the tree. Therefore, for browsers, the layout process occurs frequently. .draw. Drawing is the process of filling in pixels. It involves drawing text, colors, images, borders, and shadows, including every visible part of an element. Drawing is typically done on multiple surfaces (often called layers).
synthesis. Since parts of the page may be drawn to multiple layers, they need to be drawn to the screen in the correct order in order for the page to render correctly. This is especially important for elements that overlap another element, as a mistake could cause one element to appear incorrectly on top of another.
Every part of the pipeline has the opportunity to create glitches, so it’s important to understand exactly which parts of the pipeline your code triggers.
Not every frame will always go through every part of the pipeline. In fact, whether you are using JavaScript, CSS or web animation, when implementing visual changes, there are usually three ways to run the pipeline for a specified frame:
1. JS / CSS > Style > Layout > Draw > Synthesis

If you modify the "layout" attribute of an element, that is, change the geometric properties of the element (such as width, height, etc.), then the browser will have to check all other element and then "reflow the page" automatically. Any affected parts will need to be repainted, and the final painted elements will need to be composited.
2. JS / CSS > Style > Paint > Compositing

If you modify the "paint only" attribute (such as background image, text color or shadow, etc.), i.e. properties that do not affect the layout of the page, the browser will skip layout but will still perform drawing.
3. JS/CSS > Styles > Composition

If you change a property that requires neither relayout nor repaint, the browser will Only compositing is performed. This last approach has the least overhead and is best suited for high-stress points in the application lifecycle, such as animations or scrolling.
Performance is the art of avoiding execution and making whatever operation is performed as efficient as possible. In many cases, this requires working with the browser, not against it. It's worth keeping in mind that the various pipeline jobs listed above vary in computational overhead, with some tasks being more expensive than others!
JavaScript often triggers visual changes. Sometimes that's directly through style manipulations, and sometimes it's calculations that result in visual changes, like searching or sorting data. Improper timing or long running JavaScript can be a common cause of performance issues, and you should try to reduce its impact as much as possible.
JavaScript performance analysis can be said to be an art, because the JavaScript code you write is nothing like the code that is actually executed. Modern browsers use JIT compilers and a variety of optimizations and tricks to achieve the fastest possible execution, which greatly changes the dynamic nature of the code.
Some things to help your application perform JavaScript well:
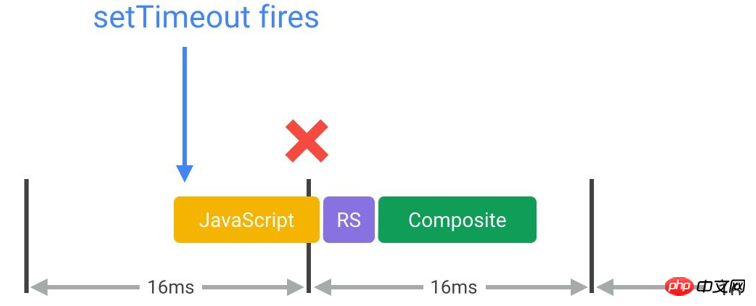
For animation effects, avoid using setTimeout or setInterval, use requestAnimationFrame.
Move long-running JavaScript from the main thread to a Web Worker.
Use small tasks to perform DOM changes across multiple frames.
Use Chrome DevTools’ Timeline and JavaScript Profiler to assess the impact of JavaScript.
When visual changes are occurring on the screen, it is best to perform operations at the beginning of the frame. The only way to guarantee that JavaScript runs at the start of a frame is to use requestAnimationFrame.
/**
 * If run as a requestAnimationFrame callback, this
 * will be run at the start of the frame. */function updateScreen(time) {  // Make visual updates here.}
requestAnimationFrame(updateScreen);A framework or example may use setTimeout or setInterval to perform visual changes such as animation, but the problem with this approach is that the callback function runs at a certain point in the frame, It could be right at the end of the frame, which often causes us to drop frames, causing stuttering. (The running of js such as composite takes time and will block UI updates).
In fact, jQuery's current default animate behavior is to use setTimeout! It is highly recommended to apply a patch to use requestAnimationFrame.
JavaScript runs on the browser's main thread, right along with style calculations, layout, and in many cases drawing. If JavaScript runs for too long, it blocks this other work, potentially causing dropped frames.
So, be careful about when JavaScript runs and for how long. For example, if you are doing an animation like scrolling, it is best to find a way to keep the JavaScript within the range of 3-4 milliseconds. Anything more than this may take up too much time. If you are free, you don't have to worry so much about the time.
In many cases, pure computational work can be moved to a Web Worker, for example, which does not require DOM access, data manipulation or traversal (such as sorting or searching), which tends to be a good fit for this model. Loading and model The same goes for generation.
var dataSortWorker = new Worker("sort-worker.js?1.1.11");
dataSortWorker.postMesssage(dataToSort);// The main thread is now free to continue working on other things...dataSortWorker.addEventListener('message', function(evt) { var sortedData = evt.data; // Update data on screen...});Not all jobs are suitable for this model: Web Workers do not have DOM access. If the operation must be performed on the main thread, consider a batch approach that splits the large task into smaller tasks, each taking no more than a few milliseconds and running within the requestAnimationFrame handler for each frame.
var taskList = breakBigTaskIntoMicroTasks(monsterTaskList);
requestAnimationFrame(processTaskList);function processTaskList(taskStartTime) {  var taskFinishTime;  do {// Assume the next task is pushed onto a stack.var nextTask = taskList.pop();// Process nextTask.    processTask(nextTask);// Go again if there’s enough time to do the next task.taskFinishTime = window.performance.now();
  } while (taskFinishTime - taskStartTime < 3);  if (taskList.length > 0)
    requestAnimationFrame(processTaskList);
}This approach has UX and UI consequences, you will need to use a progress or activity indicator to ensure the user knows the task is being processed. Under no circumstances does this method tie up the application's main thread, helping the main thread always respond quickly to user interaction.
When evaluating a framework, library, or your own code, be sure to evaluate the overhead of running JavaScript code on a frame-by-frame basis. This is especially important when performing performance-critical animation work such as transforms or scrolls.
The best way to measure JavaScript overhead and performance is to use Chrome DevTools. Typically, you will get a simple record like this:
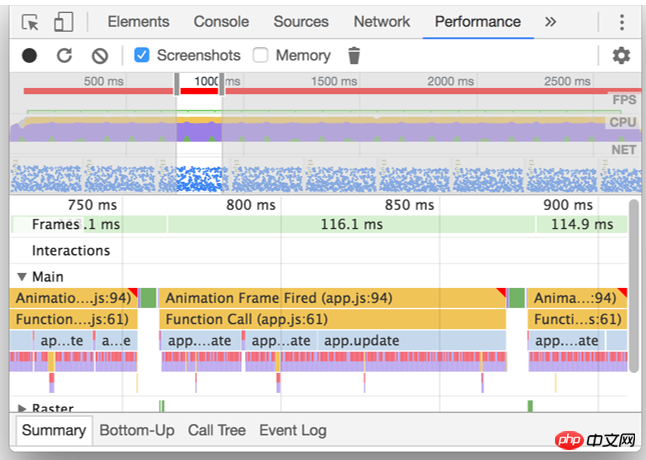
The Main section provides a flame chart of JavaScript calls so you can analyze exactly which functions were called and how long each took.
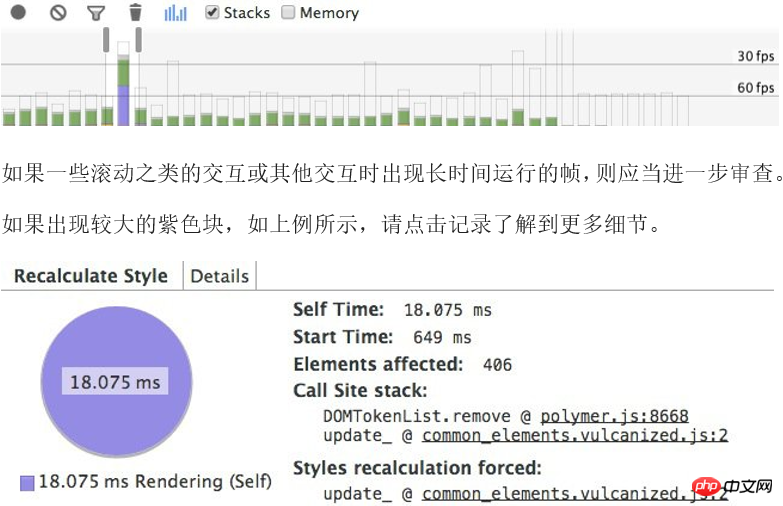
If you find long-running JavaScript, you can enable the JavaScript analyzer at the top of the DevTools user interface:
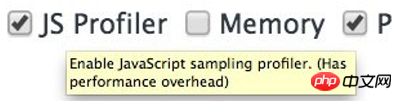
In this way There is an overhead to profiling JavaScript, so be sure to enable it only if you want a deeper understanding of JavaScript runtime features. With this checkbox enabled, you can now do the same thing and you'll get more information about which functions are called in your JavaScript:

Now that you have this information, You can evaluate the impact of JavaScript on application performance and begin to identify and correct hotspots where functions take too long to run. As mentioned before, you should try to remove long-running JavaScript, or if that is not possible, move it to a Web Worker, freeing up the main thread to continue performing other tasks.
It might be cool to know that the browser executes one version of a function 100 times faster than another, such as requesting the offsetTop of an element than calculating getBoundingClientRect () is fast, but the number of times you call such a function per frame is almost always very small. Therefore, focusing on this aspect of JavaScript performance is often wasted effort. You typically only save a few tenths of a millisecond.
If you are developing a game or computationally expensive application, you may be an exception to this guide, as you will typically fit a lot of calculations into a single frame, in which case various methods Very useful.
In short, use micro-optimizations with caution as they often don't map to the type of app you're building. According to the 2/8 rule, start optimizing at the bottleneck first.
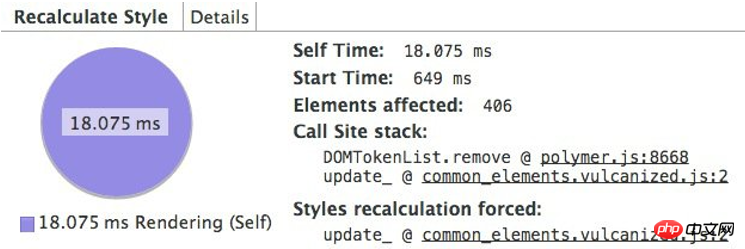
Changing the DOM by adding and removing elements, changing properties, classes, or through animations will cause the browser to restart Calculates element styles and in many cases also layouts (i.e. automatically reflows) the page or part of a page. This process is called computed style calculation.
The first part of calculating a style is creating a set of matching selectors. This is essentially the browser figuring out which classes, pseudo-selectors and IDs to apply to a given element.
The second part involves getting all the style rules from the matching selector and figuring out the final style for this element. In Blink (the rendering engine for Chrome and Opera), the overhead of these processes is roughly the same, at least for now:
Roughly 50% of the time used to calculate the computed style for an element is used to match selectors, while the other half of the time is spent building a RenderStyle (computed style representation) from the matching rules.
Reduce selector complexity; use a class-centric approach, such as the BEM specification (Block-Element_Modifer).
Reduce the number of elements whose styles must be calculated.
In the simplest case, there is only one class of elements in CSS:
.title {
/* styles */
}
However, as As the project grows, more complex CSS may be produced, and the final selector may become like this:
.box:nth-last-child(-n+1) .title {
/*
styles */
}
In order to know if a style needs to be applied, the browser actually has to ask "Is this an element with class title whose parent is exactly the negative Nth child plus 1 Elements with class box?" Computing this result may take a significant amount of time, depending on the selector used and the corresponding browser. A specific selector can be changed to a class:
.final-box-title {
/*
styles */
}
Developers may have issues with the name of the class, but the job is much simpler for browsers. In the previous version, in order to know if the element was the last of its type, the browser first had to know everything about the other elements, and whether any elements following it would be the Nth last child, which was faster than simply Matching class selectors to elements is much more expensive.
When generating the render tree, for each DOM element, the matching selector must be found in all Style Rules and the corresponding style rules must be merged.
The css selector is parsed from right to left, so that the public style is on the parent node of the CSSOM tree, and the more specific style (the selector is more specific) will be on the child node, and the node branches and traversal times will change. few. If you use the left-to-right method to read css rules, most of the rules will be found to be mismatched until the end, and a lot of useless work will be done. However, if you use the right-to-left method, you will only find that the rightmost selector does not match. If there is a match, discard it directly to avoid many invalid matches.
Another performance consideration, the amount of work required to calculate when an element changes is a more important factor for many style updates .
In general terms, the worst case cost of calculating the computed style of elements is the number of elements multiplied by the selector count, because each element needs to be at least checked once against every style rule to see if it matches.
Note: It used to be like this: if you changed a class on (for example) the body element, all child elements of the page would need to recalculate their calculated styles. Now it's a little different: for elements that cause their styles to be recalculated when changed, some browsers maintain a small set of rules that are unique to each such element. This means that, depending on the element's position in the tree and the specific properties that were changed, the element does not necessarily need to be recalculated.
Style calculations may often be directed at a small number of target elements rather than invalidating the entire page. In modern browsers, this is often less of an issue, as browsers don't necessarily need to check all elements that a change may affect. On the other hand, older browsers are not necessarily optimized for such tasks. The number of elements declared as invalid should be reduced as much as possible.
Note: If you are into web components, it is worth noting that style calculations are slightly different in this regard, as by default styles do not cross the boundaries of the Shadow DOM and are scoped to a single component instead of The whole tree. Overall, however, the same concept still applies: small trees with simple rules will be processed more efficiently than larger trees with more complex rules.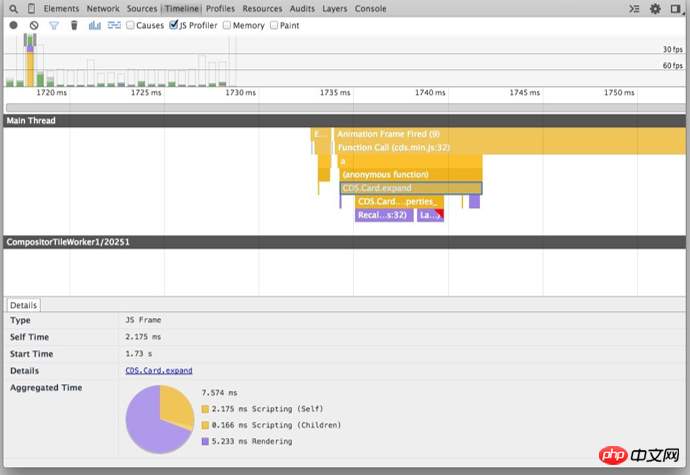
BEM's coding approach actually incorporates the performance benefits of selector matching described above, as it recommends a single class for all elements and also incorporates the name of the class when hierarchy is required:
.list { }
.list__list-item { }
If you need some modifiers, like above we want to do something special for the last child element, you can Add it as follows:
.list__list-item--last-child
{}
If you're looking for a good way to organize your CSS, BEM is really a great place to start, not only from a structural perspective, but also because style lookup is simplified.
Layout is the process by which the browser calculates the geometric information of each element: the size of the element and its position on the page. Each element will have explicit or implicit size information depending on the CSS used, the element's content, or its parent element. This process is called Layout in Chrome, Opera, Safari, and Internet Explorer. It's called automatic reflow (Reflow) in Firefox, but the process is actually the same.
Similar to style calculations, the direct considerations for layout overhead are as follows:
The number of elements that need to be laid out.
The complexity of these layouts.
#The layout scope is generally the entire document.
The number of DOM elements will affect performance and triggering layout should be avoided as much as possible.
Evaluate the performance of layout models; new versions of Flexbox are faster than older versions of Flexbox or float-based layout models.
Avoid forced synchronous layouts and layout thrashing; read style values then make style changes.
When changing styles, the browser checks whether the changes require calculation layout, and whether the render tree needs to be updated. Changes to "geometric properties" (such as width, height, left, or top) all require layout calculations.
.box {
width: 20px;
height: 20px;
}
/**Changing
width and height triggers layout. */
.box--expanded {
width: 200px;
height: 350px;
}
Layout almost always applies to the entire document. If there are a large number of elements, it will take a long time to calculate the positions and sizes of all elements.
If layout cannot be avoided, the key is to use Chrome DevTools to see how long layout takes and determine if layout is the cause of the bottleneck. First, open DevTools, select the "Timeline" tab, click the "record" button, and interact with your website. When you stop recording, you'll see a detailed analysis of your site's performance: When we set 16 milliseconds in the animation to get the frames on the screen, this layout takes too long. You can also see that DevTools will indicate the size of the tree (1618 elements in this case) and the number of nodes that need to be laid out.
 Use flexbox instead of older layout models
If we update this example to use Flexbox (the new model for the Web platform), a different situation occurs: 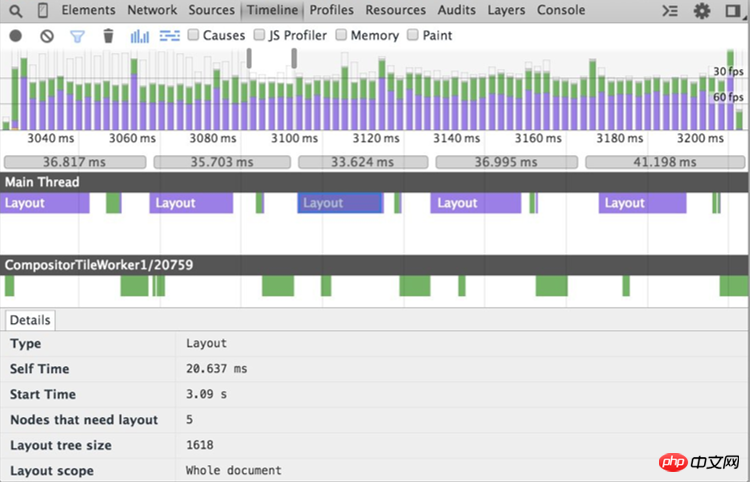
Now, for the same number of elements and the same visual appearance, layout takes much less time (3.5 ms vs. 14 ms respectively in this case). It is important to remember that for some cases Flexbox may not be an option as it is not as supported as floats, but where possible one should at least study the impact of layout models on website performance and adopt a model that minimizes the execution overhead of the web page .
In any case, whether you choose Flexbox or not, you should 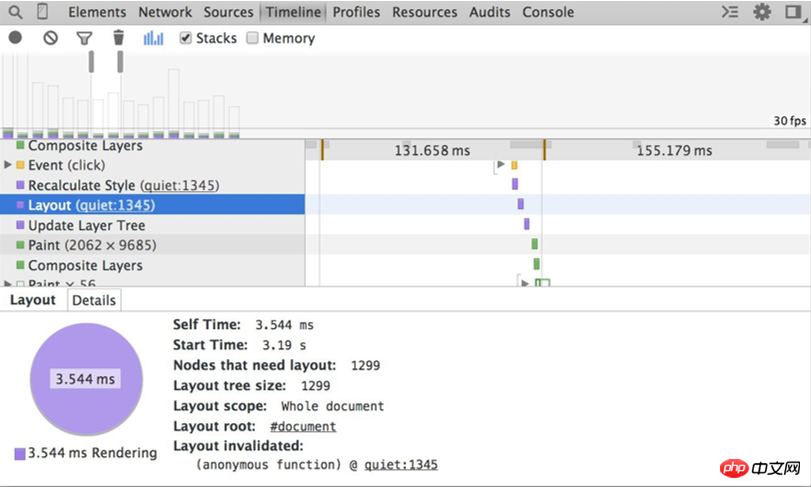 try to avoid triggering layout
Avoid forced synchronization layout
将一帧送到屏幕会采用如下顺序:

首先 JavaScript 运行,然后计算样式,然后布局。但是,JavaScript 在更改元素样式后,获取其几何属性的值,此时会强制浏览器应用新样式提前执行布局,值后才能获取几何属性值。这被称为强制同步布局(forced synchronous layout)。
要记住的第一件事是,在 JavaScript 运行时,来自上一帧的所有旧布局值是已知的,并且可供您查询。因此,如果(例如)您要在帧的开头写出一个元素(让我们称其为“框”)的高度,可能编写一些如下代码:
// Schedule our function to run at the start of the frame.requestAnimationFrame(logBoxHeight);function logBoxHeight() {  // Gets the height of the box in pixels and logs it out.  console.log(box.offsetHeight);
}如果在请求此框的高度之前,已更改其样式,就会出现问题:
function logBoxHeight() {
  box.classList.add('super-big');    //样式更改后,浏览器必须先应用新的样式(重绘)之后才能获取当前的值,有时是多做无用功
  // Gets the height of the box in pixels and logs it out.  console.log(box.offsetHeight);
}现在,为了获得框的高度,浏览器必须先应用样式更改(由于增加了 super-big 类),然后运行布局,这时才能返回正确的高度。这是不必要的,并且可能开销很大。
因此,始终应先批量读取样式并执行(浏览器可以使用上一帧的布局值),然后执行任何赋值操作。
以上函数应为:
function logBoxHeight() {  // Gets the height of the box in pixels and logs it out.  console.log(box.offsetHeight);
  box.classList.add('super-big');
}大部分情况下,并不需要先应用新样式然后查询值,使用上一帧的值就足够了。与浏览器同步(或比其提前)运行样式计算和布局可能成为瓶颈。
有一种方式会使强制同步布局更糟:连续执行大量这种强制布局。如下:
function resizeAllParagraphsToMatchBlockWidth() {  // Puts the browser into a read-write-read-write cycle.
  for (var i = 0; i < paragraphs.length; i++) {
    paragraphs[i].style.width = box.offsetWidth + 'px';
  }
}此代码循环处理一组段落,并设置每个段落的宽度以匹配一个称为“box”的元素的宽度。这看起来没有害处,但问题是循环的每次迭代读取一个样式值 (box.offsetWidth),然后立即使用此值来更新段落的宽度 (paragraphs[i].style.width)。在循环的下次迭代时,浏览器必须考虑样式已更改这一事实,因为 offsetWidth 是上次请求的(在上一次迭代中),所以它必须应用更改的样式,然后运行布局。每次迭代都将出现此问题!
此示例的修正方法还是先读取值,然后写入值:
// Read.var width = box.offsetWidth;function resizeAllParagraphsToMatchBlockWidth() {  for (var i = 0; i < paragraphs.length; i++) {// Now write.paragraphs[i].style.width = width + 'px';
  }
}如果要保证安全,应当查看 FastDOM,它会自动批处理读取和写入,应当能防止意外触发强制同步布局或布局抖动。
绘制是填充像素的过程,像素最终合成到用户的屏幕上。 它往往是管道中运行时间最长的任务,应尽可能避免此任务。
除 transform 或 opacity 属性之外,更改任何属性始终都会触发绘制。
绘制通常是像素管道中开销最大的部分,应尽可能避免绘制。
通过layer promotion和动画的编排来减少绘制区域。
使用 Chrome DevTools paint profile来评估绘制的复杂性和开销;应尽可能降低复杂性并减少开销。
如果触发布局,则总是会触发绘制,因为更改任何元素的几何属性意味着其像素需要修正!

如果更改非几何属性,例如背景、文本或阴影,也可能触发绘制。在这些情况下,不需要布局,并且管道将如下所示:

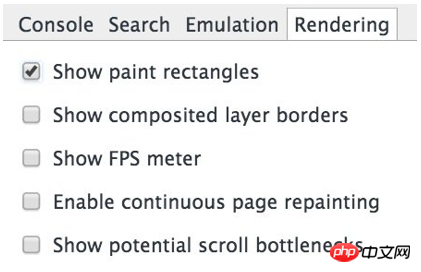
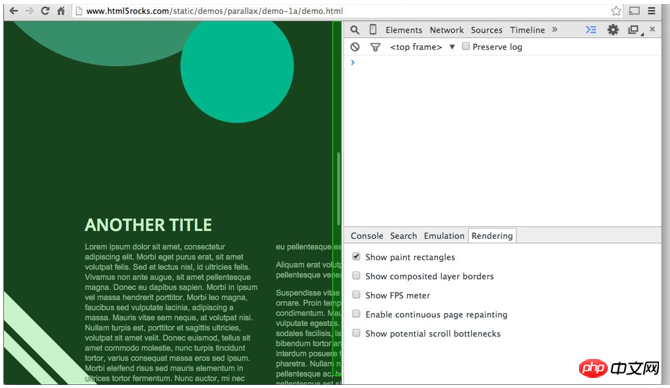
You can use Chrome DevTools to quickly determine the area being drawn. Open DevTools and press the Esc key on your keyboard. In the panel that appears, go to the "rendering" tab and check "Show paint rectangles".
When this option is turned on, Chrome will make the screen flash green every time drawing occurs. If you see the entire screen flashing green, or you see areas of the screen that shouldn't be drawn, you should investigate further.
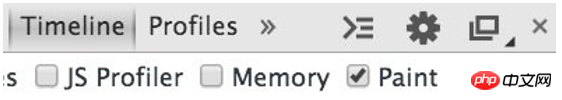
There is an option in Chrome DevTools Timeline that provides more information: Draw Analyzer. To enable this option, go to Timeline and check the "Paint" box at the top. As a note, be sure to only turn this option on when trying to analyze drawing problems, as it incurs overhead and can affect profiling results. Best used when you want to get a deeper understanding of what exactly is being drawn.
After completing the above settings, you can now run Timeline recording, and the drawing record will contain more details. By clicking on a frame's draw record, you will enter the draw analyzer for that frame:
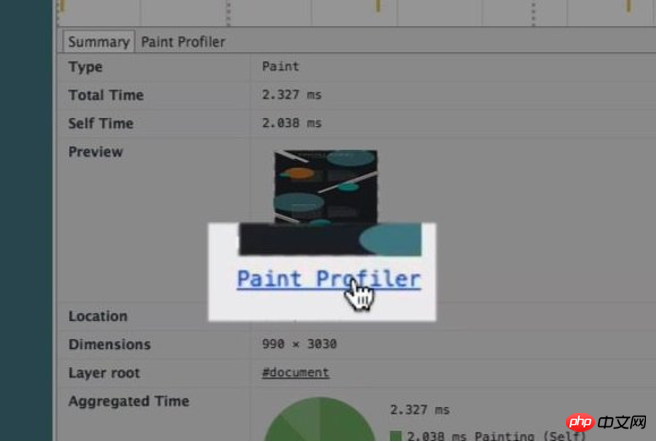
Clicking on the draw analyzer will bring up a view where you can view the elements that were drawn , the time it took, and the individual draw calls required: , both of which are aspects that can be corrected.
Lift moved or faded elements The best way to create a new layer is to use the will-change CSS property. This method works on Chrome, Opera and Firefox, and will create a new compositor layer with the value of transform :
.moving-element {
will-change: transform;}
For browsers that do not support will-change but benefit from layer creation, such as Safari and Mobile Safari, you need to use 3D transformation to force the creation of a new layer:
.moving-element {
}
But please note: do not create too many layers, because each layer requires memory and management overhead.
If you have promoted an element to a new layer, use DevTools to confirm that doing so has resulted in performance benefits.
Reduce the drawing area
Using the paint analyzer above, you can determine if you need to look for other ways to achieve the effect. Ask yourself if it's possible to achieve the end result using a less expensive set of styles or alternative ways.
You want to avoid drawing as much as possible, especially in animation effects. Because the time budget of
10 millisecondsper frame is generally not enough to complete the drawing work, especially on mobile devices.
The above is the detailed content of Browser rendering performance optimization. For more information, please follow other related articles on the PHP Chinese website!
 what is optimization
 The computer has Internet access but the browser cannot open the web page
 What does browser mean
 Baidu keyword optimization software
 Browser compatibility
 How to solve the problem of garbled characters when opening a web page
 Baidu SEO keyword ranking optimization method
 ie shortcut cannot be deleted


![[Web front-end] Node.js quick start](https://img.php.cn/upload/course/000/000/067/662b5d34ba7c0227.png)


