
Saving and restoring state
Before understanding deformation, I will first introduce two methods that are indispensable when you start drawing complex graphics. The
save()
restore()
and restore methods are used to save and restore the canvas state, and have no parameters. The state of the Canvas is a snapshot of all styles and transformations applied to the current screen. The Canvas state is saved in a stack. Every time the save method is called, the current state will be pushed into the stack and saved. You can call the save method as many times as you like. Each time the restore method is called, the last saved state is popped from the heap and all settings are restored.
Application examples of save and restore
We try to use this example of a continuous rectangle to describe how the canvas state heap works.
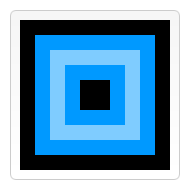
The first step is to draw a large square with the default settings, and then save the state. Change the fill color and draw a second, smaller blue square, then save the state again. Change the fill color again and draw a smaller translucent white square. The actions done so far are very similar to those in the previous chapters. But once we call restore, the last state in the state heap will pop up and all settings will be restored. If the state was not saved with save before, then we need to manually change the settings back to the previous state. This is still applicable to two or three attributes. Once there are more, our code will skyrocket. When restore is called for the second time, it has been restored to the original state, so in the end a black square is drawn again.
function draw() {
     var ctx = document.getElementById('canvas').getContext('2d');

     ctx.fillRect(0,0,150,150);   // Draw a rectangle with default settings
     ctx.save();                  // Save the default state

     ctx.fillStyle = '#09F'       // Make changes to the settings
     ctx.fillRect(15,15,120,120); // Draw a rectangle with new settings

     ctx.save();                  // Save the current state
     ctx.fillStyle = '#FFF'       // Make changes to the settings
     ctx.globalAlpha = 0.5;
     ctx.fillRect(30,30,90,90);   // Draw a rectangle with new settings

     ctx.restore();               // Restore previous state
     ctx.fillRect(45,45,60,60);   // Draw a rectangle with restored settings

     ctx.restore();               // Restore original state
     ctx.fillRect(60,60,30,30);   // Draw a rectangle with restored settings
}Move Translating
We first introduce the translate method, which is used to move the canvas and its origin to a different position.
translate(x, y)
translate
The method accepts two parameters. x is the left and right offset, y is the up and down offset, as shown in the figure below.
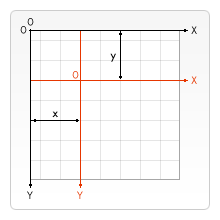
#It is a good practice to save the state before doing transformations. In most cases, calling the restore method is much simpler than manually restoring the original state. Also, if you do displacement in a loop but do not save and restore the state of the canvas, you will probably find that something is missing in the end, because it is likely to be beyond the scope of the canvas.
translate
Example
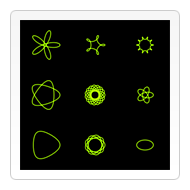
This example shows some of the benefits of moving the canvas origin. I created a drawSpirograph method to draw a spiral (spirograph) pattern, which is drawn around the origin. If you don't use the translate method, only a quarter of it will be visible. Translate also allows me to place these patterns arbitrarily without having to manually adjust the coordinate values in the spirograph method, which is easy to understand and use. I called the drawSpirograph method 9 times in the draw method, using 2 layers of loops. Each time through the loop, the canvas is first moved, the spiral pattern is drawn, and then restored to the original state.
function draw() {
      var ctx = document.getElementById('canvas').getContext('2d');
      ctx.fillRect(0,0,300,300);
      for (var i=0;i<3;i++) {
        for (var j=0;j<3;j++) {
          ctx.save();
          ctx.strokeStyle = "#9CFF00";
          ctx.translate(50+j*100,50+i*100);
          drawSpirograph(ctx,20*(j+2)/(j+1),-8*(i+3)/(i+1),10);
         ctx.restore();
        }
      }
   }
  function drawSpirograph(ctx,R,r,O){
     var x1 = R-O;
     var y1 = 0;
     var i  = 1;
     ctx.beginPath();
     ctx.moveTo(x1,y1);
     do {
       if (i>20000) break;
       var x2 = (R+r)*Math.cos(i*Math.PI/72) - (r+O)*Math.cos(((R+r)/r)*(i*Math.PI/72))
       var y2 = (R+r)*Math.sin(i*Math.PI/72) - (r+O)*Math.sin(((R+r)/r)*(i*Math.PI/72))
       ctx.lineTo(x2,y2);
       x1 = x2;
       y1 = y2;
       i++;
     } while (x2 != R-O && y2 != 0 );
     ctx.stroke();
}Rotating Rotating
The second introduces the rotate
method, which is used to rotate the canvas with the origin as the center.
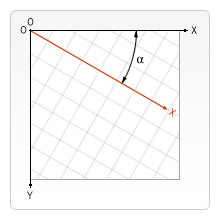
rotate(angle)
这个方法只接受一个参数:旋转的角度(angle),它是顺时针方向的,以弧度为单位的值。旋转的中心点始终是 canvas 的原点,如果要改变它,我们需要用到translate
方法。
rotate
的例子
在这个例子里,见下图,我用rotate方法来画圆并构成圆形图案。当然你也可以分别计算出 x 和 y 坐标(x = r*Math.cos(a); y = r*Math.sin(a))。这里无论用什么方法都无所谓的,因为我们画的是圆。计算坐标的结果只是旋转圆心位置,而不是圆本身。即使用rotate旋转两者,那些圆看上去还是一样的,不管它们绕中心旋转有多远。这里我们又用到了两层循环。第一层循环决定环的数量,第二层循环决定每环有多少个点。每环开始之前,我都保存一下 canvas 的状态,这样恢复起来方便。每次画圆点,我都以一定夹角来旋转 canvas,而这个夹角则是由环上的圆点数目的决定的。最里层的环有 6 个圆点,这样,每次旋转的夹角就是 360/6 = 60 度。往外每一环的圆点数目是里面一环的 2 倍,那么每次旋转的夹角随之减半。
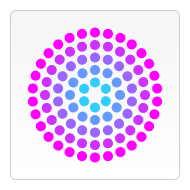
function draw() {
var ctx = document.getElementById('canvas').getContext('2d');
ctx.translate(75,75);
for (var i=1;i<6;i++){ // Loop through rings (from inside to out)
ctx.save();
ctx.fillStyle = 'rgb('+(51*i)+','+(255-51*i)+',255)';
for (var j=0;j<i*6;j++){ // drawindividual dots
ctx.rotate(Math.PI*2/(i*6));
ctx.beginPath();
ctx.arc(0,i*12.5,5,0,Math.PI*2,true);
ctx.fill();
}
ctx.restore();
}
}缩放 Scaling
接着是缩放。我们用它来增减图形在 canvas 中的像素数目,对形状,位图进行缩小或者放大。
scale(x, y)
scale
方法接受两个参数。x,y 分别是横轴和纵轴的缩放因子,它们都必须是正值。值比 1.0 小表示缩小,比 1.0 大则表示放大,值为 1.0 时什么效果都没有。默认情况下,canvas 的 1 单位就是 1 个像素。举例说,如果我们设置缩放因子是 0.5,1 个单位就变成对应 0.5 个像素,这样绘制出来的形状就会是原先的一半。同理,设置为 2.0 时,1 个单位就对应变成了 2 像素,绘制的结果就是图形放大了 2 倍。
scale
的例子
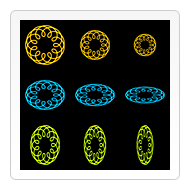
这最后的例子里,我再次启用前面曾经用过的 spirograph 方法,来画 9 个图形,分别赋予不同的缩放因子。左上角的图形是未经缩放的。黄色图案从左到右应用了统一的缩放因子(x 和 y 参数值是一致的)。看下面的代码,你可以发现,我在画第二第三个图案时scale了两次,中间没有 restorecanvas 的状态,因此第三个图案的缩放因子其实是 0.75 × 0.75 = 0.5625。第二行蓝色图案堆垂直方向应用了不统一的缩放因子,每个图形 x 方向上的缩放因子都是 1.0,意味着不缩放,而 y 方向缩放因子是 0.75,得出来的结果是,图案被依次压扁了。原来的圆形图案变成了椭圆,如果细心观察,还可以发现在垂直方向上的线宽也减少了。第三行的绿色图案与第二行类似,只是缩放限定在横轴方向上了。
function draw() {
  var ctx = document.getElementById('canvas').getContext('2d');
  ctx.strokeStyle = "#fc0";
  ctx.lineWidth = 1.5;
  ctx.fillRect(0,0,300,300);

  // Uniform scaling
  ctx.save()
  ctx.translate(50,50);
  drawSpirograph(ctx,22,6,5);

  ctx.translate(100,0);
  ctx.scale(0.75,0.75);
  drawSpirograph(ctx,22,6,5);

  ctx.translate(133.333,0);
  ctx.scale(0.75,0.75);
  drawSpirograph(ctx,22,6,5);
  ctx.restore();

  // Non uniform scaling (y direction)
  ctx.strokeStyle = "#0cf";
  ctx.save()
  ctx.translate(50,150);
  ctx.scale(1,0.75);
  drawSpirograph(ctx,22,6,5);

  ctx.translate(100,0);
  ctx.scale(1,0.75);
  drawSpirograph(ctx,22,6,5);

  ctx.translate(100,0);
  ctx.scale(1,0.75);
  drawSpirograph(ctx,22,6,5);
  ctx.restore();

  // Non uniform scaling (x direction)
  ctx.strokeStyle = "#cf0";
  ctx.save()
  ctx.translate(50,250);
  ctx.scale(0.75,1);
  drawSpirograph(ctx,22,6,5);

  ctx.translate(133.333,0);
  ctx.scale(0.75,1);
  drawSpirograph(ctx,22,6,5);

  ctx.translate(177.777,0);
  ctx.scale(0.75,1);
  drawSpirograph(ctx,22,6,5);
  ctx.restore();

}
function drawSpirograph(ctx,R,r,O){
  var x1 = R-O;
  var y1 = 0;
  var i  = 1;
  ctx.beginPath();
  ctx.moveTo(x1,y1);
  do {
    if (i>20000) break;
    var x2 = (R+r)*Math.cos(i*Math.PI/72) - (r+O)*Math.cos(((R+r)/r)*(i*Math.PI/72))
    var y2 = (R+r)*Math.sin(i*Math.PI/72) - (r+O)*Math.sin(((R+r)/r)*(i*Math.PI/72))
    ctx.lineTo(x2,y2);
    x1 = x2;
    y1 = y2;
    i++;
  } while (x2 != R-O && y2 != 0 );
  ctx.stroke();
}变形 Transforms
最后一个方法是允许直接对变形矩阵作修改。
m11     m21     dx
m12     m22     dy
0       0       1
setTransform(m11, m12, m21, m22, dx, dy)
这个方法必须重置当前的变形矩阵为单位矩阵,然后以相同的参数调用transform
方法。如果任意一个参数是无限大,那么变形矩阵也必须被标记为无限大,否则会抛出异常。
transform/setTransform的例子
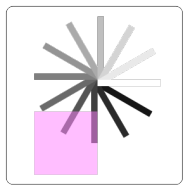
function draw() {
      var canvas = document.getElementById("canvas");
      var ctx = canvas.getContext("2d");

      var sin = Math.sin(Math.PI/6);
      var cos = Math.cos(Math.PI/6);
      ctx.translate(200, 200);
      var c = 0;
      for (var i=0; i <= 12; i++) {
        c = Math.floor(255 / 12 * i);
        ctx.fillStyle = "rgb(" + c + "," + c + "," + c + ")";
        ctx.fillRect(0, 0, 100, 10);
        ctx.transform(cos, sin, -sin, cos, 0, 0);
      }

     ctx.setTransform(-1, 0, 0, 1, 200, 200);
     ctx.fillStyle = "rgba(255, 128, 255, 0.5)";
     ctx.fillRect(0, 50, 100, 100);
}以上就是canvas游戏开发学习之七:变形的内容,更多相关内容请关注PHP中文网(m.sbmmt.com)!


