I discovered by chance before that when react is rendering on the server, when NODE_ENV != production, it will cause a memory leak. Specific issues: https://github.com/facebook/react/issues/7406. With the widespread use of node, react isomorphism and other technologies, issues such as node-side memory leaks should attract our attention. Why node is prone to memory leaks and how to troubleshoot them after they occur. Below is a brief introduction and example to illustrate.
First of all, node is based on the v8 engine, and its memory management method is consistent with v8. The following is a brief introduction to the related memory effects of v8.
V8 memory limit
Node is built based on V8 and allocates and manages js objects through V8. V8 has limitations on the use of memory (old generation memory is about 1.4G in 64-bit systems, about 0.7G in 32-bit systems, new generation memory in 64-bit systems is about 32MB, and 32-bit systems is about 16MB). Under such restrictions, large memory objects cannot be manipulated. If you accidentally touch this limit, it will cause the process to exit.
Reason: V8 will block JavaScript application logic when performing garbage collection, and then re-execute JavaScript application logic until the garbage collection is completed. This behavior is called "stop-the-world". If the heap memory of V8 is 1.5GB, it will take more than 50ms for V8 to do a small garbage collection, and it will even take more than 1 second to do a non-incremental garbage collection.
Use node --max-old-space-size=xxx (unit MB), node --max-new-space-size=xxx (unit KB) to set the new generation memory and old generation memory to crack Default memory limit.
V8’s heap composition
The V8 heap is actually not just composed of the old generation and the new generation. The heap can be divided into several different areas:
New generation memory area: Most objects are allocated here. This area is small but garbage collection is particularly frequent.
Old generation pointer area: It belongs to the old generation. It contains most of the pointers that may point to other objects. Objects, most of the objects promoted from the new generation will be moved here
Old generation data area: Belongs to the old generation, only original data objects are stored here, these objects do not have pointers to other objects
Large object area: This is where objects whose size exceeds the size of other areas are stored. Each object has its own memory. Garbage collection will not move large objects.
Code area: code objects, which contain instructions after JIT. The object will be allocated here. The only memory area with execution permission
Cell area, attribute Cell area, Map area: stores Cell, attribute Cell and Map. Each area stores elements of the same size and has a simple structure
GC recycling type
Incremental GC
Indicates whether the garbage collector collects (increases) garbage when scanning the memory space and empties the garbage at the end of the scan cycle.
Non-incremental GC
When using a non-incremental garbage collector, garbage will be emptied as soon as it is collected.
The garbage collector will only perform garbage collection on the new generation memory area, old generation pointer area and old generation data area. Objects first enter the new generation memory that takes up less space. Most objects will expire quickly, and non-incremental GC directly reclaims these small amounts of memory. If some objects cannot be recycled within a period of time, they will be moved to the old generation memory area. This area performs infrequent incremental GC and takes a long time.
When will a memory leak occur?
Paths of memory leaks
Memory leaks
Cache
Queue consumption is not timely
Scope is not released
The memory composition of Node is mainly the part allocated through V8 and the part allocated by Node itself. The main limitation of V8's garbage collection is V8's heap memory. The main reasons for memory leaks: 1. Cache; 2. Queue consumption is not timely; 3. The scope is not released
Memory leak analysis
View V8 memory usage (unit byte )
process.memoryUsage(); { ress: 47038464, heapTotal: 34264656, heapUsed: 2052866 }
ress: The resident memory part of the process
heapTotal, heapUsed: V8 heap memory information
View system Memory usage (unit byte)
os.totalmem()
os.freemem()
Return the total system memory and idle memory
View garbage Recycling log
node --trace_gc -e "var a = []; for( var i = 0; i < 1000000; i++ ) { a.push(new Array(100)); }" > ;> gc.log //Output garbage collection log
node --prof //Output node execution performance log. Use windows-tick.processor to view.
Analysis and monitoring tool
v8-profiler Captures snapshots of v8 heap memory and analyzes cpu
node-heapdump Captures snapshots of v8 heap memory
node -mtrace analyzes the stack using
node-memwatch to monitor garbage collection
node-memwatch
memwatch.on('stats',function(info){ console.log(info) }) memwatch.on('leak',function(info){ console.log(info) })
stats event: every When a full heap garbage collection is performed, a stats event will be triggered. This event will deliver memory statistics.
{ "num_full_gc": 17, //第几次全栈垃圾回收 "num_inc_gc": 8, //第几次增量垃圾回收 "heap_compactions": 8, //第几次对老生代进行整理 "estimated_base": 2592568, //预估基数 "current_base": 2592568, //当前基数 "min": 2499912, //最小 "max": 2592568, //最大 "usage_trend": 0 //使用趋势 }
Observe num_full_gc and num_inc_gc to reflect the garbage collection situation.
leak event: If the memory is still not released after five consecutive garbage collections, it means a memory leak occurs. At this time, a leak event will be triggered.
{ start: Fri, 29 Jun 2012 14:12:13 GMT, end: Fri, 29 Jun 2012 14:12:33 GMT, growth: 67984, reason: 'heap growth over 5 consecutive GCs (20s) - 11.67 mb/hr' }
Heap Diffing 堆内存比较 排查内存溢出代码。
下面,我们通过一个例子来演示如何排查定位内存泄漏:
首先我们创建一个导致内存泄漏的例子:
//app.js var app = require('express')(); var http = require('http').Server(app); var heapdump = require('heapdump'); var leakobjs = []; function LeakClass(){ this.x = 1; } app.get('/', function(req, res){ console.log('get /'); for(var i = 0; i < 1000; i++){ leakobjs.push(new LeakClass()); } res.send('Hello world
'); }); setInterval(function(){ heapdump.writeSnapshot('./' + Date.now() + '.heapsnapshot'); }, 3000); http.listen(3000, function(){ console.log('listening on port 3000'); });
这里我们通过设置一个不断增加且不回被回收的数组,来模拟内存泄漏。
通过使用heap-dump模块来定时纪录内存快照,并通过chrome开发者工具profiles来导入快照,对比分析。
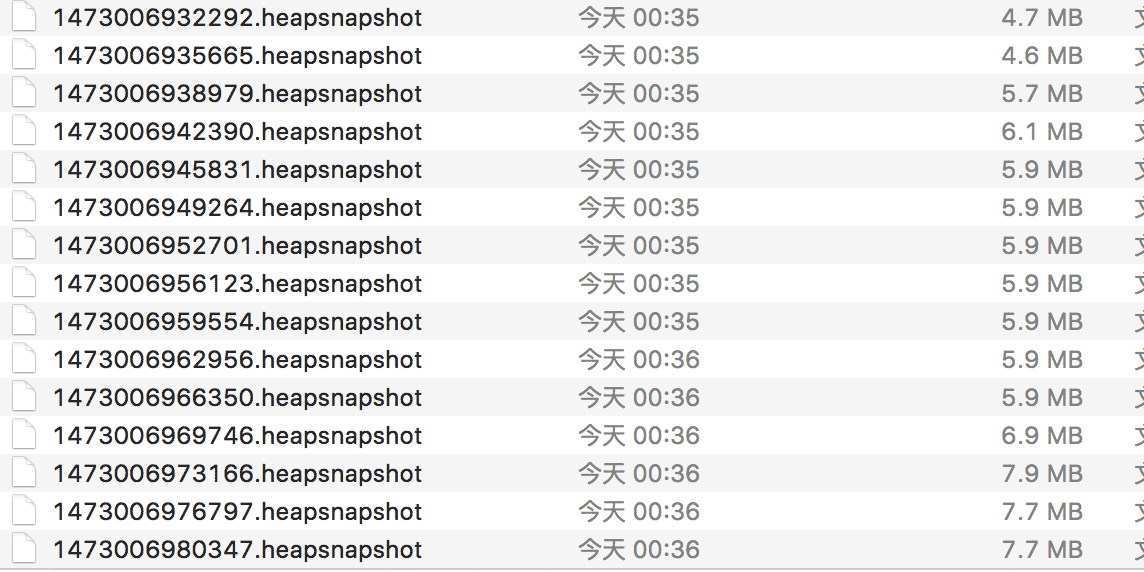
我们可以看到,在浏览器访问 localhost:3000 ,并多次刷新后,快照的大小一直在增长,且即使不请求,也没有减小,说明已经发生了泄漏。

接着我们通过过chrome开发者工具profiles, 导入快照。通过设置comparison,对比初始快照,发送请求,平稳,再发送请求这3个阶段的内存快照。可以发现右侧new中LeakClass一直增加。在delta中始终为正数,说明并没有被回收。

小结
针对内存泄漏可以采用植入memwatch,或者定时上报process.memoryUsage内存使用率到monitor,并设置告警阀值进行监控。
当发现内存泄漏问题时,若允许情况下,可以在本地运行node-heapdump,使用定时生成内存快照。并把快照通过chrome Profiles分析泄漏原因。若无法本地调试,在测试服务器上使用v8-profiler输出内存快照比较分析json(需要代码侵入)。
需要考虑在什么情况下开启memwatch/heapdump。考虑heapdump的频度以免耗尽了CPU。 也可以考虑其他的方式来检测内存的增长,比如直接监控process.memoryUsage()。
当心误判,短暂的内存使用峰值表现得很像是内存泄漏。如果你的app突然要占用大量的CPU和内存,处理时间可能会跨越数个垃圾回收周期,那样的话memwatch很有可能将之误判为内存泄漏。但是,这种情况下,一旦你的app使用完这些资源,内存消耗就会降回正常的水平。所以需要注意的是持续报告的内存泄漏,而可以忽略一两次突发的警报。
更多Detailed explanation of nodeJs memory leak problem相关文章请关注PHP中文网!


