Introduction: Most services run on Linux. Linux has now been widely used, but there are still many problems. Let’s discuss our performance monitoring indicators. Performance monitoring is nothing more than I/O, memory, CPU, number of TCP connections, network, process or thread. The commands used are iostat, vmstat, sar, mpstat, netstat, ss, iftop, free, pstree/ps, pidstat, top, ( uptime) let’s go into more detail below.
1. Disk I/O (iostat)
A lot of data on our machine is stored on the disk, and a lot of the data we read has to interact with the disk , but the disk is also a low-speed device and may be blocked in many cases, so disk I/O monitoring is very important. We use iostat to diagnose disk conditions. The machine used is Tencent Cloud host.

ps: The number of transmissions per second of the device, indicating how many I/O requests per second
Blk_read/s: The amount of data read from the device per second
Blk_wrtn/s: To the device per second Amount of data written
Blk_read: Total amount of data read
Blk_wrtn: Total amount of data written
%user: Represents the CPU load used by user mode processes
%nice: Represents priority process use CPU load
%system: represents the CPU load used by the kernel state process
%iowait: represents the CPU load when the CPU is waiting for I/O
%steal: represents the stolen CPU load, this is used in virtualization Will be used in technology
%idle: represents the idle CPU load
iostat also has a commonly used parameter option -x, which represents extended information

rrqm/s: related to this device per second How many read requests have been merged (multiple I/O merge operations)
wrqm/s: How many write requests related to this device have been merged per second
r/s: sent to per second The number of read requests of the device
w/s: the number of write requests sent to the device per second
rsec/s: the number of reads of device sectors per second
wsec/s: the number of writes to device sectors per second Times
avgrq-sz: average request sector size
avgqu-sz: average request queue length
await: average processing time (waiting time) of each I/O request
r_await: each read The average processing time of I/O requests
w_await: The average processing time of each write I/O request
svctm: Indicates the average service time of each I/O operation. If the svctm value and the await value are very close, it means that there is almost no waiting for I/O. If the await value is much higher than the svctm value, it means that the I/O queue wait is too long.
%util: There are a total of How much time is spent processing I/O operations, that is, the percentage of CPU consumed. For example, the statistical time interval is 1s, then the device is processing I/O for 0.65s and idle for 0.35s. Then the %util=0.65/1=65% of this device. Generally, if this parameter is 100%, it means that the device is running close to full capacity (of course, if there are multiple disks, even if %util is 100%, because of the concurrency capability of the disk , so disk usage may not necessarily reach the bottleneck)
2. Memory (free)
In the Linux system, we check the memory usage. Use the free command to view the information in the first line of

(we can think of it from the operating system level)
total: total physical memory size
used: allocated size
free: not allocated Size
shared: the size of shared memory, mainly used for IPC communication
buffers: used for buffering of block devices
cached: used for file content buffering, that is, cache
"Cache" is to divide a block in the memory Area, as a buffer between the process and the hard disk, the process writes data into the cache. When the data needs to be read, it will be read directly from the "highway" cache instead of the "dirt road" hard disk. Reading, which greatly speeds up performance
The buffer here actually stores the metadata of our data (including directory name, file size, file storage block, modification time, permissions, etc.), while the cache stores our recently read data. Retrieved documents.
The third line of information (we can think of it from the application level)
The -/+ buffers/cache here are -buffers/cache and +buffers/cache respectively
-buffers/cache = used (No. One line) -buffers-cached is actually the "physical memory" "actually used" by the current program
+buffers/cache = buffers+cached It means the size of memory temporarily "lent" to the system for use as a "buffer"
used=(+buffers/cached)+(-buffers/cached)
So from the application level, available memory = free memory+buffers+cached
We can view the detailed information in the following way.
~ cat /proc/meminfo
MemTotal: 1020128 kB
MemFree: 670772 kB
Buffers: 97780 kB
Cached: 100980 kB
SwapCached: 0 kB
Active: 164988 kB
Inactive: 117296 kB
Active(anon): 83536 kB
Inactive(anon): 160 kB
Active(file): 81452 kB
Inactive(file): 117136 kB
Unevictable: 0 kB
Mlocked: 0 kB
SwapTotal: 0 kB
SwapFree: 0 kB
Dirty: 92 kB
Writeback: 0 kB
AnonPages: 83504 kB
Mapped: 17500 kB
Shmem: 172 kB
Slab: 46696 kB
SReclaimable: 28652 kB
SUnreclaim: 18044 kB
KernelStack: 1744 kB
PageTables: 2636 kB
NFS_Unstable: 0 kB
Bounce: 0 kB
WritebackTmp: 0 kB
CommitLimit: 510064 kB
Committed_AS: 343800 kB
VmallocTotal: 34359738367 kB
VmallocUsed: 7112 kB
VmallocChunk: 34359727304 kB
HardwareCorrupted: 0 kB
AnonHugePages: 36864 kB
HugePages_Total: 0
HugePages_Free: 0
HugePages_Rsvd: 0
HugePages_Surp: 0
Hugepagesize: 2048 kB
DirectMap4k: 8184 kB
DirectMap2M: 1040384 kB
三,CPU(dstat,mpstat)
首先我们使用dstat命令来查看下我们的CPU情况,他能够实时的输出我们的信息,
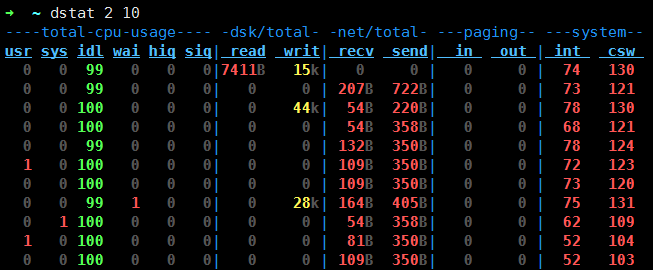
每2秒输出一次,一共输出10次
cpu:hiq、siq分别为硬中断和软中断次数
system:int、csw分别为系统的中断次数(interrupt)和上下文切换次数(context switch)。
-c:表示只显示我们的CPU信息
-m:表示只显示我们的内存信息
-p:表示只显示我们的进程信息
-n:表示只显示我们的网络信息
我们想以什么为什么优先顺序查看,可以在后面加下列参数
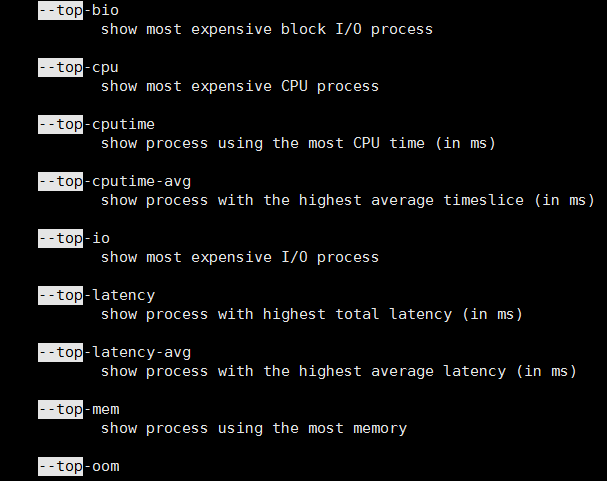
mpstat

%user 在internal时间段里,用户态的CPU时间(%),不包含nice值为负进程 (usr/total)*100
%nice 在internal时间段里,nice值为负进程的CPU时间(%) (nice/total)*100
%sys 在internal时间段里,内核时间(%) (system/total)*100
%iowait 在internal时间段里,硬盘IO等待时间(%) (iowait/total)*100
%irq 在internal时间段里,硬中断时间(%) (irq/total)*100
%soft 在internal时间段里,软中断时间(%) (softirq/total)*100
%idle 在internal时间段里,CPU除去等待磁盘IO操作外的因为任何原因而空闲的时间闲置时间(%) (idle/total)*100
四,TCP连接数(ss,netstat)
ss是Socket Statistics的缩写,顾名思义ss命令就是用来获取sockets的信息,他可以显示和netstat类似的内容,但是他比netstat更快更高效,而且显示更为详细的有关TCP连接信息。当我们的sockets连接数非常大的时候,无论是我们使用netstat命令还是在内核中查看连接数cat /proc/net/tcp的时候都会很缓慢。
The reason why ss is fast is that it uses tcp_diag in the TCP protocol. tcp_diag is a module used for analysis and statistics. It can obtain first-hand information in the Linux kernel, which ensures the efficiency of ss.
We can make a comparison between netstat and ss. There are pictures and the truth


The time of the netstat command is obviously much slower than the time of the ss command
The netstat command

We can see Connection status information to the daemon process in the system and the monitored port number
-t: Indicates TCP connection
-u: Indicates UDP connection
-n: Indicates displaying information in the form of numbers
-p: Indicates displaying the listening port number
View the monitoring status of the daemon process in the system
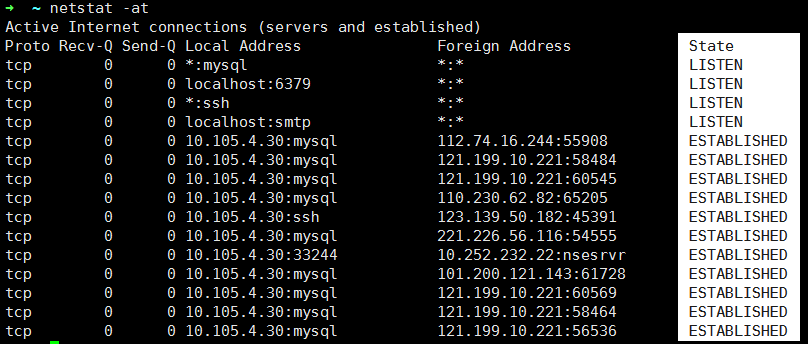
We can see the State status display
ss command
View the network connection statistics of the current server: ss - s

The usage of other ss is the same as that of netstat
5. Network (iftop)
Use iftop -i eth0

Use Ctrl+c to exit, exit display

We can use the -i parameter to monitor different network card traffic information. In which interface of iftop we can press p to view the port traffic information

6. Process information (ps/pstree, top, pidstat)
We use pstree to view our process tree, all processes are child processes of the init process
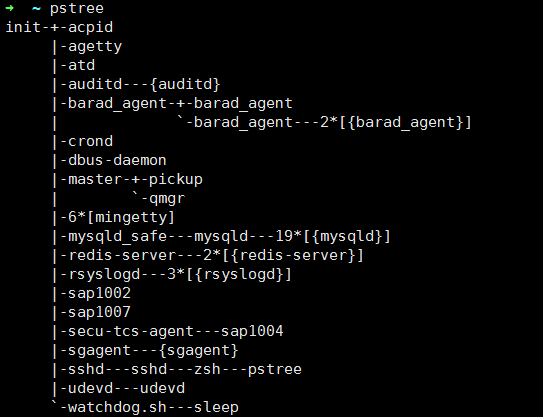
ps command
to view specific processes, such as the MySQL process we can use ps aux mysqld or ps -elf mysqld , there is essentially no difference between the two, because Linux inherits some ideas from Unix, one is the Sys-v style of Unix, and the other is the BSD style

We can see his information in detail
pidstat command
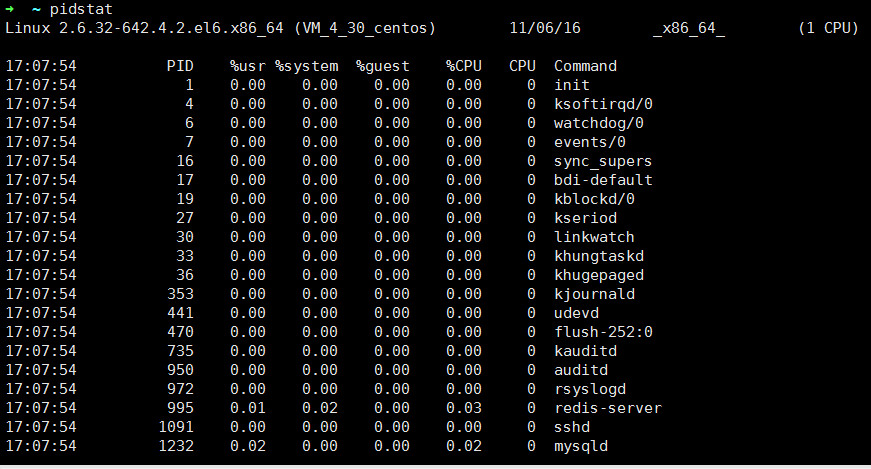
We can use pidstat to view the pid status information of each process and the CPU information it occupies
Comprehensive display (vmstat, top, sar)

We see the memory, Swap partition, I/O, CPU, and process context switching times
top command
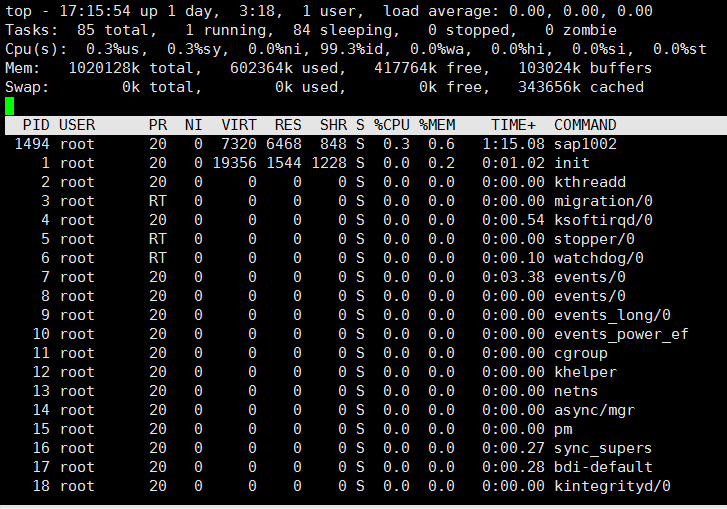
In this interface:
Press m to sort by memory usage
Press P to sort by CPU usage
Press M to sort by resident memory size
Press k to kill a process
sar command
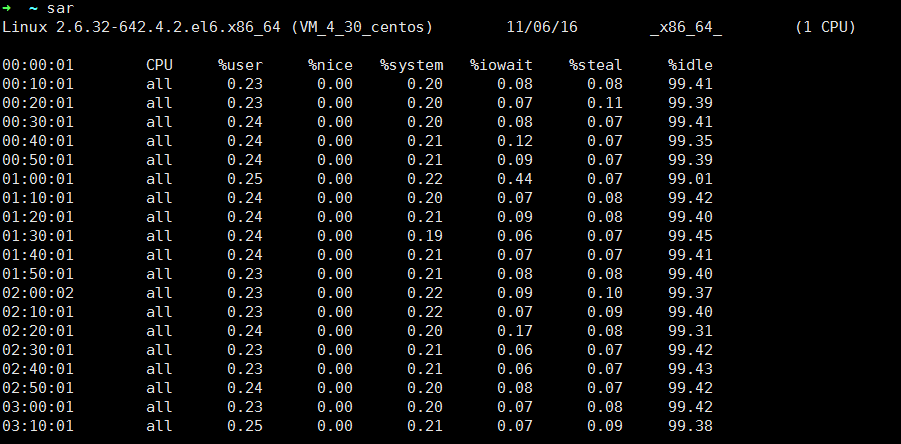
Sometimes we may need to count how long it took our Linux to start, we can use The uptime command displays this information, top can also display
The uptime command

top command displays


