Home > Web Front-end > JS Tutorial > body text

Graphical method of using Firebug to debug js with breakpoints_javascript skills

WBOY
Release: 2016-05-16 18:08:33
Original
828 people have browsed it

Specific steps:

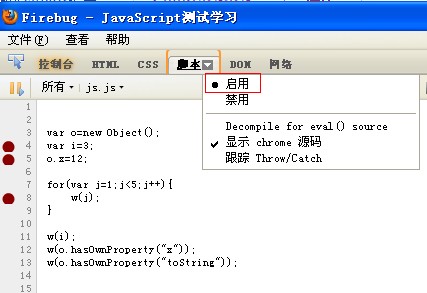
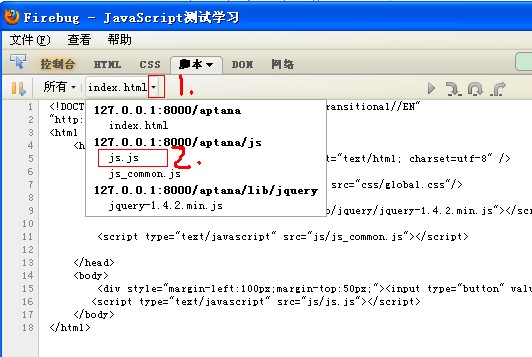
a. After opening Firebug, enable "script" debugging and find the referenced script file (or inline js);

Graphical method of using Firebug to debug js with breakpoints_javascript skills

Graphical method of using Firebug to debug js with breakpoints_javascript skills

Graphical method of using Firebug to debug js with breakpoints_javascript skills

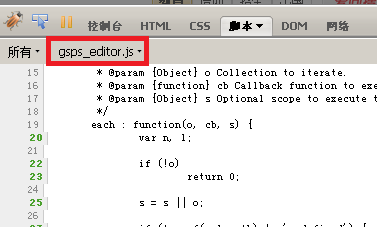
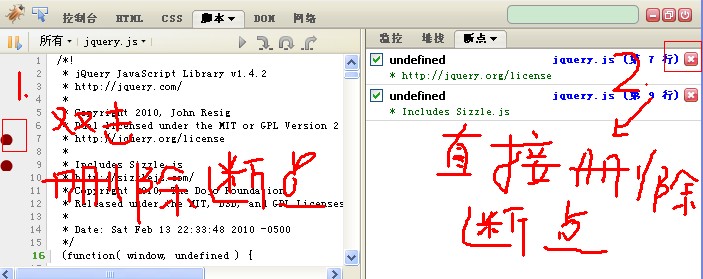
b. Add breakpoints at appropriate locations;

c. If the breakpoint has been executed, refresh the page and the script will interrupt at the breakpoint. If the breakpoint has not been executed, you can directly execute the action on the page (such as clicking a button, etc.), and then the code will interrupt at the breakpoint;

Graphical method of using Firebug to debug js with breakpoints_javascript skills

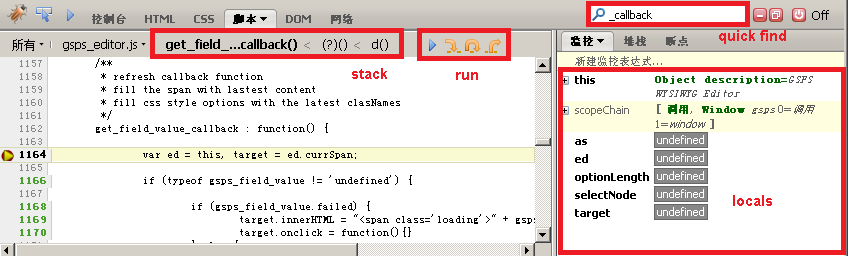
d. Observe the function call stack, observe local variables, and perform single-step execution for debugging.

It’s really simple! The advantages of debugging with Firebug breakpoints are summarized as follows:

  • The lines where breakpoints can be added are numbered in green, which is very intuitive;
  • The call stack is displayed in two ways, which is very convenient;
  • The display of local variables is very clear and concise.

Graphical method of using Firebug to debug js with breakpoints_javascript skills

Related labels:
source:php.cn
Statement of this Website
The content of this article is voluntarily contributed by netizens, and the copyright belongs to the original author. This site does not assume corresponding legal responsibility. If you find any content suspected of plagiarism or infringement, please contact admin@php.cn
Popular Tutorials
More>
Latest Downloads
More>
Web Effects
Website Source Code
Website Materials
Front End Template
About us Disclaimer Sitemap
php.cn:Public welfare online PHP training,Help PHP learners grow quickly!