 web3.0
 What are the RSI indicators in cryptocurrencies? How do you look at them? Is the higher the better?
What are the RSI indicators in cryptocurrencies? How do you look at them? Is the higher the better?
RSI indicator: interpret market momentum and accurately grasp trading opportunities
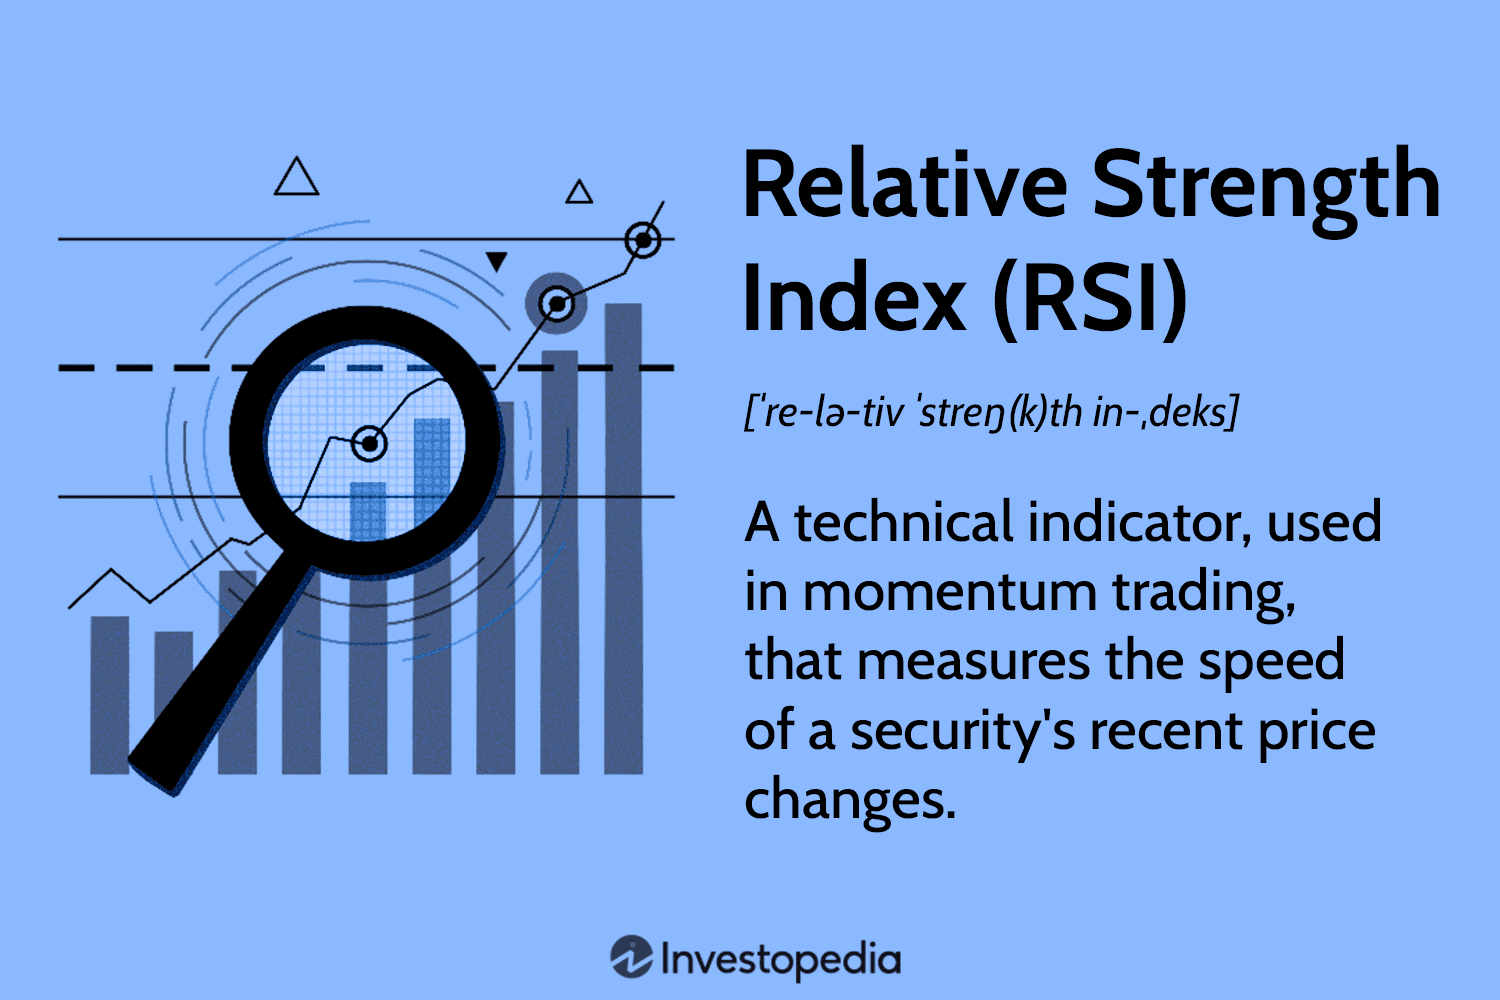
RSI (relative strength indicator) is a momentum indicator commonly used in technical analysis. It is used to evaluate the potential momentum of asset prices and to determine whether the market is in an overbought or oversold state. This article will conduct in-depth discussion on the principles, usage methods and application of RSI indicators in cryptocurrency trading.

Detailed explanation of RSI indicators
RSI indicator was proposed by Welles Wilder in 1978, and its value fluctuates between 0 and 100, with 50 as the central axis. Above 50 is usually considered a long market, while below 50 is a short market.
- Overbought Zone (RSI > 70): Prices may face a pullback.
- Overselling Zone (RSI Prices may rebound.
It should be noted that under the strong trend, RSI may stay in overbought or oversold areas for a long time. Therefore, it is crucial to confirm in combination with other indicators. The bullish and bearish divergence of RSI is also an important analytical signal:
- Bulsive divergence: RSI shows oversold, but the price continues to fall, indicating a potential increase.
- Bearly divergence: RSI shows overbought, but the price continues to rise, indicating a potential decline.
Calculation method of RSI indicator
The calculation formula of RSI is: RSI = [Average of rising / (Average of rising, average of falling)] × 100
Among them, the average value of the rise and the average value of the decline are the average value of the price increase and decline in a specific period respectively. For example, calculating the 6-day RSI requires the average of the price increase and decline in the past 6 days.
How to use RSI indicators
There are many ways to use the RSI indicator:
- Cross method: Observe the intersection of different parameters (such as 6-day RSI and 12-day RSI) curves to judge the changes in long-short forces.
- Numerical method:Judge buying and selling signals based on the relationship between RSI values and key levels such as 50, 70, and 30.
- Model method: Identify the graphical patterns formed by the RSI curve at high or low levels (such as head and shoulder top, head and shoulder bottom, etc.) and predict the price trend.
- Trend method: Analyze the trend direction of the RSI curve and judge the continuity of the long and short trends.
RSI indicator parameter setting and skills
The parameter setting of RSI indicator mainly involves time period selection. Short-term investors can choose shorter cycles (such as 4 days and 6 days), while long-term investors can choose longer cycles (such as 14 days and 21 days). In actual application, parameters need to be dynamically adjusted according to the market environment and personal trading strategies. Some practical tips include: focus on the dead golden fork, numerical range, morphological analysis, and the divergence of price from RSI.
Limitations of RSI indicators
RSI indicators are not perfect, the following problems may arise:
- Error Signal: RSI may send a signal that is opposite to the actual trend.
- Long-term overbought/oversold: Under the strong trend, RSI may stay in the overbought or oversold area for a long time.
- Pasticity: RSI indicator may fail in extreme market conditions.
Application of RSI indicator in cryptocurrency trading
The cryptocurrency market is highly volatile, and RSI indicators should be used with caution. Other indicators need to be combined with attention and risk management is paid.
RSI indicator viewing platform
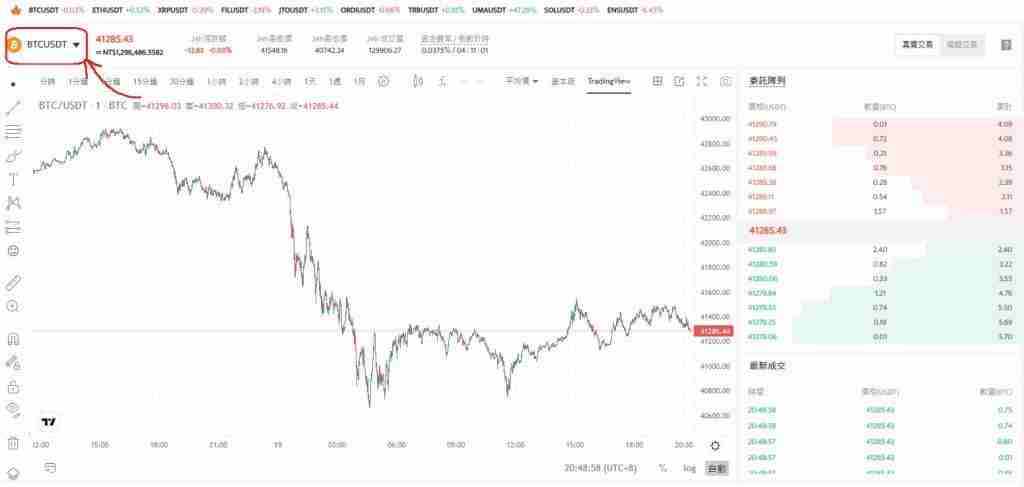
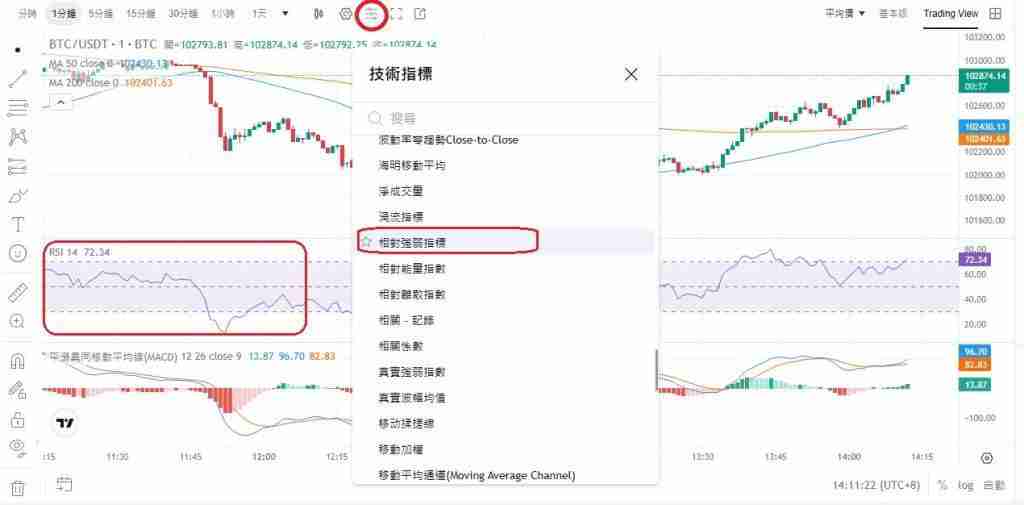
Many trading platforms (such as TradingView) provide RSI indicators. For example, BTCC exchange users can view TradingView charts directly on the platform and customize RSI parameters.


FAQ
- Q: What are the RSI indicators? A: Momentum indicator that measures market momentum and overbought/oversold state.
- Q: RSI key level? A: 30 (oversold), 50 (central axis), 70 (overbought).
- Q: Is the higher the RSI, the better? A: Not necessarily, high RSI may indicate a callback.
- Q: How much is the RSI lower than oversold? A: Usually below 30.
- Q: How many days does RSI have to be watched? A: It is commonly used for 14 days and can be adjusted as needed.
Summary
RSI indicators are effective technical analysis tools, but they need to be used with caution and combined with other indicators and market analysis to improve the accuracy of trading decisions. Remember the importance of risk management.
The above is the detailed content of What are the RSI indicators in cryptocurrencies? How do you look at them? Is the higher the better?. For more information, please follow other related articles on the PHP Chinese website!

Hot AI Tools

Undresser.AI Undress
AI-powered app for creating realistic nude photos

AI Clothes Remover
Online AI tool for removing clothes from photos.

Undress AI Tool
Undress images for free

Clothoff.io
AI clothes remover

AI Hentai Generator
Generate AI Hentai for free.

Hot Article

Hot Tools

Notepad++7.3.1
Easy-to-use and free code editor

SublimeText3 Chinese version
Chinese version, very easy to use

Zend Studio 13.0.1
Powerful PHP integrated development environment

Dreamweaver CS6
Visual web development tools

SublimeText3 Mac version
God-level code editing software (SublimeText3)

Hot Topics
 What is Ouyi for? What is Ouyi
Apr 01, 2025 pm 03:18 PM
OKX is a global digital asset trading platform. Its main functions include: 1. Buying and selling digital assets (spot trading), 2. Trading between digital assets, 3. Providing market conditions and data, 4. Providing diversified trading products (such as derivatives), 5. Providing asset value-added services, 6. Convenient asset management.
 How to send a POST request containing JSON data using PHP's cURL library?
Apr 01, 2025 pm 03:12 PM
Sending JSON data using PHP's cURL library In PHP development, it is often necessary to interact with external APIs. One of the common ways is to use cURL library to send POST�...
 How to efficiently integrate Node.js or Python services under LAMP architecture?
Apr 01, 2025 pm 02:48 PM
Many website developers face the problem of integrating Node.js or Python services under the LAMP architecture: the existing LAMP (Linux Apache MySQL PHP) architecture website needs...
 How to configure apscheduler timing task as a service on macOS?
Apr 01, 2025 pm 06:09 PM
Configure the apscheduler timing task as a service on macOS platform, if you want to configure the apscheduler timing task as a service, similar to ngin...
 Can Python parameter annotations use strings?
Apr 01, 2025 pm 08:39 PM
Alternative usage of Python parameter annotations In Python programming, parameter annotations are a very useful function that can help developers better understand and use functions...
 In LangChain, how do I use AgentExecutor to replace the disabled initialize_agent function?
Apr 01, 2025 pm 04:18 PM
How to replace the disabled initialize_agent function in LangChain? In the LangChain library, initialize_agent...
 How to ensure high availability of MongoDB on Debian
Apr 02, 2025 am 07:21 AM
This article describes how to build a highly available MongoDB database on a Debian system. We will explore multiple ways to ensure data security and services continue to operate. Key strategy: ReplicaSet: ReplicaSet: Use replicasets to achieve data redundancy and automatic failover. When a master node fails, the replica set will automatically elect a new master node to ensure the continuous availability of the service. Data backup and recovery: Regularly use the mongodump command to backup the database and formulate effective recovery strategies to deal with the risk of data loss. Monitoring and Alarms: Deploy monitoring tools (such as Prometheus, Grafana) to monitor the running status of MongoDB in real time, and
 Can the Python interpreter be deleted in Linux system?
Apr 02, 2025 am 07:00 AM
Regarding the problem of removing the Python interpreter that comes with Linux systems, many Linux distributions will preinstall the Python interpreter when installed, and it does not use the package manager...


