Measuring the execution time of requests to external services is critical for performance monitoring and optimization. However, when connections to these external services are pooled, you might be inadvertently measuring more than just the request time. Specifically, if requests are taking too long and you run out of available connections, your custom logic may start including the waiting time to get a connection from the pool. This can lead to misleading metrics, causing you to misinterpret the performance of your system. Let's delve into how this happens and how you can avoid being fooled by your own metrics.
When all connections in the pool are in use, additional requests must wait until a connection becomes available. This waiting time can skew your metrics if not measured separately from the actual request time.
If your custom logic measures the total time from when the request was made until a response is received, you are including both the waiting time and the request time.
To illustrate how you can be fooled by your own metrics in a connection-pooled environment, let's walk through a practical example using Spring Boot and Apache HttpClient 5. We'll set up a simple Spring Boot application that makes HTTP requests to an external service, measure the execution time of these requests, and demonstrate how connection pool exhaustion can lead to misleading metrics.
To simulate delays in the external service, we will use the httpbin Docker image. Httpbin provides an easy-to-use HTTP request and response service, which we can use to create artificial delays in our requests.
@SpringBootApplication @RestController public class Server { public static void main(String... args) { SpringApplication.run(Server.class, args); } class TimeClientHttpRequestInterceptor implements ClientHttpRequestInterceptor { @Override public ClientHttpResponse intercept(HttpRequest request, byte[] body, ClientHttpRequestExecution execution) throws IOException { var t0 = System.currentTimeMillis(); try { return execution.execute(request, body); } finally { System.out.println("Request took: " + (System.currentTimeMillis() - t0) + "ms"); } } } @Bean public RestClient restClient() { var connectionManager = new PoolingHttpClientConnectionManager(); connectionManager.setMaxTotal(2); // Max number of connections in the pool connectionManager.setDefaultMaxPerRoute(2); // Max number of connections per route return RestClient.builder()// .requestFactory(new HttpComponentsClientHttpRequestFactory( HttpClients.custom().setConnectionManager(connectionManager).build())) .baseUrl("http://localhost:9091")// .requestInterceptor(new TimeClientHttpRequestInterceptor()).build(); } @GetMapping("/") String hello() { return restClient().get().uri("/delay/2").retrieve().body(String.class); } }
In the above code we created a request interceptor (ClientHttpRequestInterceptor) to measure what we thought would be the execution time of requests to the external service backed by httpbin.
We also explicitly set the pool to a very small size of 2 connections to make it easy to reproduce the problem.
Now we just need to start httpbin, run our spring boot app and conduct a simple test using ab
$ docker run -p 9091:80 kennethreitz/httpbin
ab -n 10 -c 4 http://localhost:8080/ ... Percentage of the requests served within a certain time (ms) 50% 4049 66% 4054 75% 4055 80% 4055 90% 4057 95% 4057 98% 4057 99% 4057 100% 4057 (longest request)
Request took: 2021ms Request took: 2016ms Request took: 2022ms Request took: 4040ms Request took: 4047ms Request took: 4030ms Request took: 4037ms Request took: 4043ms Request took: 4050ms Request took: 4034ms
If we look at the numbers, we can see that even though we set an artificial delay of 2 seconds for the external server, we're actually getting a delay of 4 seconds for most requests. Moreover, we notice that only the first requests honor the configured delay of 2 seconds, while subsequent requests result in a delay of 4 seconds.
Profiling is essential when encountering strange code behavior because it identifies performance bottlenecks, uncovers hidden issues like memory leaks, and shows how your application uses system resources.
This time we’ll profile the running app using JFR while conducting the ab load testing.
$ jcmdJFR.start name=app-profile duration=60s filename=app-profile-$(date +%FT%H-%M-%S).jfr
$ ab -n 50 -c 4 http://localhost:8080/ ... Percentage of the requests served within a certain time (ms) 50% 4043 66% 4051 75% 4057 80% 4060 90% 4066 95% 4068 98% 4077 99% 4077 100% 4077 (longest request)
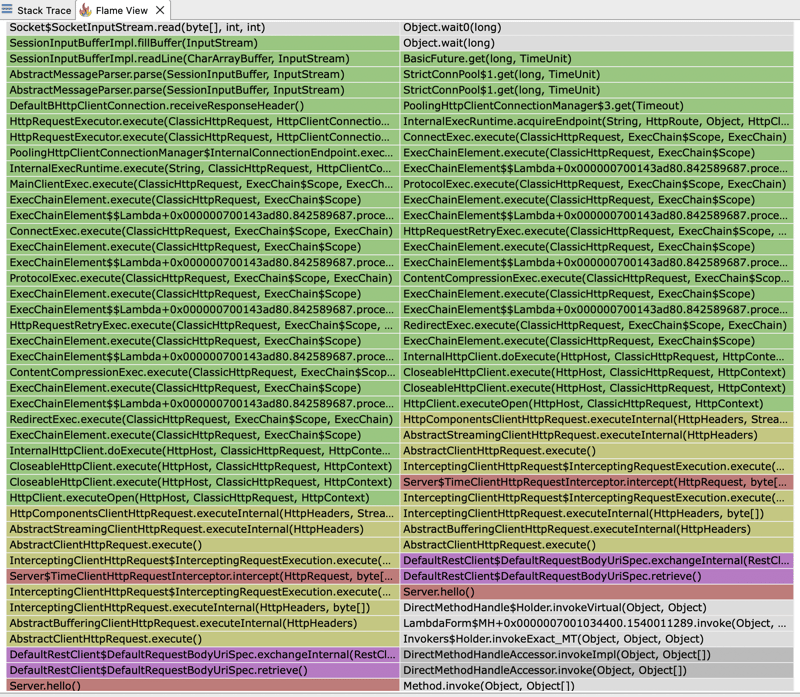
If we open the JFR file and look at the flamegraph, we can see that most of the execution time is spent by our HTTP client. The client's execution time is divided between waiting for our external service to respond and waiting to get a connection from the pool.

That explains why the response times we see are double the expected fixed delay of 2 seconds we set for our external server. We configured a pool of 2 connections. However, in our test, we're performing 4 concurrent requests. So, only the first 2 requests will be served in the expected time of 2 seconds. Subsequent requests will have to wait for the pool to release a connection, thus increasing the observed response time.
If we look at the flamegraph again we can also find out why the time measured by our ClientHttpRequestInterceptor does not reflect the time the external server takes to respond but the time it takes to get a connection from the pool plus the time it takes to perform the actual request to the external server. Our interceptor is actually wrapping a stack trace that ends up calling a pool manager to get a connection: PoolingHttpClientConnectionManager
Die Überwachung der Antwortzeit eines HTTP-Clients erfolgt am besten mithilfe der integrierten Metriken, da diese Metriken speziell für die Erfassung präziser Zeitinformationen entwickelt wurden. Sie berücksichtigen alle Aspekte des HTTP-Anforderungslebenszyklus, einschließlich Verbindungsaufbau, Datenübertragung und Antwortverarbeitung. Dadurch wird sichergestellt, dass die Messungen genau sind und mit der tatsächlichen Leistung des Kunden übereinstimmen.
The above is the detailed content of Metrics Can Fool You: Measuring Execution Time in Connection-Pooled Environments. For more information, please follow other related articles on the PHP Chinese website!


