When we observe aslow system, our first instinct might be to label it asfailing. This presumption is widespread and highlights a fundamental truth: performance is synonymous with an application's maturity and readiness for production.
In web applications, where milliseconds can determine the success or failure of a user interaction, the stakes are incredibly high. Performance is not just a technical benchmark, but a cornerstone of user satisfaction and operational efficiency.
Performance encapsulates a system's responsiveness under varying workloads, quantified by metrics such as CPU and memory utilization, response times, scalability, and throughput.
In this article, we will explore how AppSignal can monitor and enhance the performance of Django applications.
Let's get started!
Achieving optimal performance in Django applications involves a multifaceted approach. This means developing applications that run efficiently and maintain their efficiency as they scale. Key metrics are crucial in this process, providing tangible data to guide our optimization efforts. Let's explore some of these metrics.
In this article, we'll construct a Django-based e-commerce store ready for high-traffic events, integrating AppSignal to monitor, optimize, and ensure it scales seamlessly under load. We'll also demonstrate how to enhance an existing application with AppSignal for improved performance (in this case, the Open edX learning management system).
To follow along, you'll need:
Now let's create a directory for our project and clone it from GitHub. We'll install all the requirements and run a migration:
mkdir django-performance && cd django-performance python3.12 -m venv venv source venv/bin/activate git clone -b main https://github.com/amirtds/mystore cd mystore python3.12 -m pip install -r requirements.txt python3.12 manage.py migrate python3.12 manage.py runserver
Now visit 127.0.0.1:8000. You should see something like this:

This Django application is a simplee-commerce storethat provides product lists, details, and a checkout page for users. After successfully cloning and installing the app, use the Django createsuperuser management command to create a superuser.
Now let's create a couple of products in our application. First, we'll shell into our Django application by running:
python3.12 manage.py shell
Create 3 categories and 3 products:
from store.models import Category, Product # Create categories electronics = Category(name='Electronics', description='Gadgets and electronic devices.') books = Category(name='Books', description='Read the world.') clothing = Category(name='Clothing', description='Latest fashion and trends.') # Save categories to the database electronics.save() books.save() clothing.save() # Now let's create new Products with slugs and image URLs Product.objects.create( category=electronics, name='Smartphone', description='Latest model with high-end specs.', price=799.99, stock=30, available=True, slug='smartphone', image='products/iphone_14_pro_max.png' ) Product.objects.create( category=books, name='Python Programming', description='Learn Python programming with this comprehensive guide.', price=39.99, stock=50, available=True, slug='python-programming', image='products/python_programming_book.png' ) Product.objects.create( category=clothing, name='Jeans', description='Comfortable and stylish jeans for everyday wear.', price=49.99, stock=20, available=True, slug='jeans', image='products/jeans.png' )
Now close the shell and run the server. You should see something like the following:

We'll install AppSignal and opentelemetry-instrumentation-django in our project.
Before installing these packages, log in to AppSignal using your credentials (you can sign up for a free 30-day trial). After selecting an organization, click onAdd appat the top right of the navigation bar. Choose Python as your language and you'll receive apush-api-key.
Make sure your virtual environment is activated and run the following commands:
python3.12 -m pip install appsignal==1.2.1 python3.12 -m appsignal install --push-api-key [YOU-KEY] python3.12 -m pip install opentelemetry-instrumentation-django==0.45b0
Provide the app name to the CLI prompt. After installation, you should see a new file called __appsignal__.py in your project.
Now let's create a new file called .env in the project root and add APPSIGNAL_PUSH_API_KEY=YOUR-KEY (remember to change the value to your actual key). Then, let's change the content of the __appsignal__.py file to the following:
# __appsignal__.py import os from appsignal import Appsignal # Load environment variables from the .env file from dotenv import load_dotenv load_dotenv() # Get APPSIGNAL_PUSH_API_KEY from environment push_api_key = os.getenv('APPSIGNAL_PUSH_API_KEY') appsignal = Appsignal( active=True, name="mystore", push_api_key=os.getenv("APPSIGNAL_PUSH_API_KEY"), )
Next, update the manage.py file to read like this:
# manage.py #!/usr/bin/env python """Django's command-line utility for administrative tasks.""" import os import sys # import appsignal from __appsignal__ import appsignal # new line def main(): """Run administrative tasks.""" os.environ.setdefault("DJANGO_SETTINGS_MODULE", "mystore.settings") # Start Appsignal appsignal.start() # new line try: from django.core.management import execute_from_command_line except ImportError as exc: raise ImportError( "Couldn't import Django. Are you sure it's installed and " "available on your PYTHONPATH environment variable? Did you " "forget to activate a virtual environment?" ) from exc execute_from_command_line(sys.argv) if __name__ == "__main__": main()
We've imported AppSignal and started it using the configuration from __appsignal.py.
Please note that the changes we made to manage.py are for a development environment. In production, we should change wsgi.py or asgi.py. For more information, visit AppSignal's Django documentation.
As we approach the New Year sales on our Django-based e-commerce platform, we recall last year's challenges:increased trafficled toslow load timesand even some downtime. This year, we aim to avoid these issues by thoroughly testing and optimizing our site beforehand. We'll use Locust to simulate user traffic and AppSignal to monitor our application's performance.
First, we'll create a locustfile.py file that simulates simultaneous users navigating through critical parts of our site: the homepage, a product detail page, and the checkout page. This simulation helps us understand how our site performs under pressure.
Create the locustfile.py in the project root:
# locustfile.py from locust import HttpUser, between, task class WebsiteUser(HttpUser): wait_time = between(1, 3) # Users wait 1-3 seconds between tasks @task def index_page(self): self.client.get("/store/") @task(3) def view_product_detail(self): self.client.get("/store/product/smartphone/") @task(2) def view_checkout_page(self): self.client.get("/store/checkout/smartphone/")
In locustfile.py, users primarily visit the product detail page, followed by the checkout page, and occasionally return to the homepage. This pattern aims to mimic realistic user behavior during a sale.
Before running Locust, ensure you have a product with thesmartphoneslug in the Django app. If you don't, go to /admin/store/product/ and create one.
Before we start, let's define what we consider an acceptable response time. For a smooth user experience, we aim for:
These targets ensure users experience minimal delay, keeping their engagement high.
With our Locust test ready, we run it to simulate the 500 users and observe the results in real time. Here's how:
After running Locust, you can find information about the load test in its dashboard:

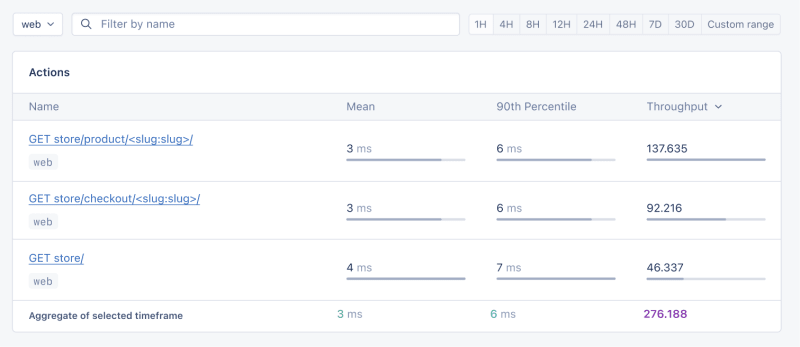
Now, go to your application page in AppSignal. Under thePerformancesection, click onActionsand you should see something like this:

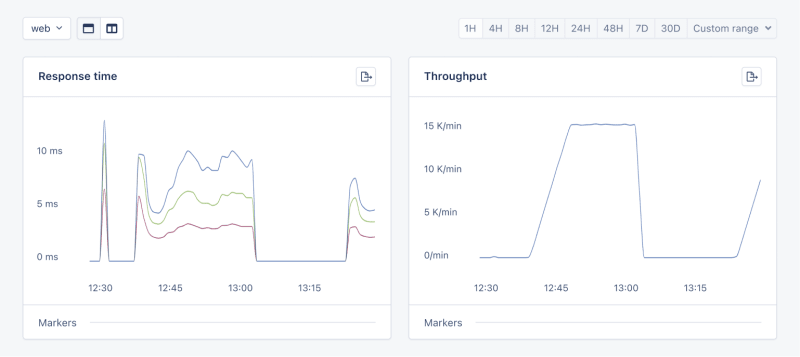
Now let's click on theGraphsunderPerformance:

We need to prepare our site for the New Year sales, as response times might exceed our targets. Here's a simplified plan:
When it comes to web applications, one of the most common sources of slow performance is database queries. Every time a user performs an action that requires data retrieval or manipulation, a query is made to the database.
If these queries are not well-optimized, they can take a considerable amount of time to execute, leading to a sluggish user experience. That's why it's crucial to monitor and optimize our queries, ensuring they're efficient and don't become the bottleneck in our application's performance.
Before diving into the implementation, let's clarify two key concepts in performance monitoring:
Instrumentationis the process of augmenting code to measure its performance and behavior during execution. Think of it like fitting your car with a dashboard that tells you not just the speed, but also the engine's performance, fuel efficiency, and other diagnostics while you drive.
Spans, on the other hand, are the specific segments of time measured by instrumentation. In our car analogy, a span would be the time taken for a specific part of your journey, like from your home to the highway. In the context of web applications, a span could represent the time taken to execute a database query, process a request, or complete any other discrete operation.
Instrumentation helps us create a series of spans that together form a detailed timeline of how a request is handled. This timeline is invaluable for pinpointing where delays occur and understanding the overall flow of a request through our system.
With our PurchaseProductView, we're particularly interested in the database interactions that create customer records and process purchases. By adding instrumentation to this view, we'll be able to measure these interactions and get actionable data on their performance.
Here's how we integrate AppSignal's custom instrumentation into our Django view:
# store/views.py # Import OpenTelemetry's trace module for creating custom spans from opentelemetry import trace # Import AppSignal's set_root_name for customizing the trace name from appsignal import set_root_name # Inside the PurchaseProductView def post(self, request, *args, **kwargs): # Initialize the tracer for this view tracer = trace.get_tracer(__name__) # Start a new span for the view using 'with' statement with tracer.start_as_current_span("PurchaseProductView"): # Customize the name of the trace to be more descriptive set_root_name("POST /store/purchase/") # ... existing code to handle the purchase ... # Start another span to monitor the database query performance with tracer.start_as_current_span("Database Query - Retrieve or Create Customer"): # ... code to retrieve or create a customer ... # Yet another span to monitor the purchase record creation with tracer.start_as_current_span("Database Query - Create Purchase Record"): # ... code to create a purchase record ...
See the full code of the view after the modification.
In this updated view, custom instrumentation is added to measure the performance of database queries when retrieving or creating a customer and creating a purchase record.
Now, after purchasing a product in theSlow eventssection of thePerformancedashboard, you should see the purchase event, its performance, and how long it takes to run the query.

purchase is the event we added to our view.
In this section, we are going to see how we can integrate AppSignal with Open edX, an open-source learning management system based on Python and Django.
Monitoring the performance of learning platforms like Open edX is highly important, since a slow experience directly impacts students' engagement with learning materials and can have a negative impact (for example, a high number of users might decide not to continue with a course).
Here, we can follow similar steps as theProject Setupsection. However, for Open edX, we will followProduction Setupand initiate AppSignal in wsgi.py. Check out this commit to install and integrate AppSignal with Open edX.
Now we'll interact with our platform and see the performance result in the dashboard.
Let's register a user, log in, enroll them in multiple courses, and interact with the course content.
Going toActions, let's order the actions based on their mean time and find slow events:

As we can see, for 3 events (out of the 34 events we tested) the response time is higher than 1 second.
Host Metricsin AppSignal show resource usage:

Notre système n'est pas soumis à une charge importante — la charge moyenne est de 0,03 — mais l'utilisation de la mémoire est élevée.
Nous pouvons également ajouter un déclencheur pour recevoir une notification lorsque l'utilisation des ressources atteint une condition spécifique. Par exemple, nous pouvons définir un déclencheur lorsque l'utilisation de la mémoire dépasse 80 % pour être averti et éviter les pannes.

Lorsque nous remplissons la condition, vous devriez recevoir une notification comme celle-ci :

Dans Open edX, nous utilisons Celery pour des tâches asynchrones et de longue durée telles que la génération de certificats, la notation et la fonctionnalité de courrier électronique en masse.
En fonction de la tâche et du nombre d'utilisateurs, certaines de ces tâches peuvent s'exécuter pendant une longue période et entraîner des problèmes de performances sur notre plateforme.
Par exemple, si des milliers d'utilisateurs sont inscrits à un cours et que nous devons les réévaluer, cette tâche peut prendre un certain temps. Nous pouvons recevoir des plaintes d'utilisateurs indiquant que leur note n'est pas reflétée dans le tableau de bord car la tâche est toujours en cours d'exécution. Avoir des informations sur les tâches Celery, leur durée d'exécution et leur utilisation des ressources nous donne des informations importantes et des points d'amélioration possibles pour notre application.
Utilisons AppSignal pour tracer nos tâches Celery dans Open edX et voir le résultat dans le tableau de bord. Tout d’abord, assurez-vous que la configuration requise est installée. Ensuite, définissons nos tâches pour suivre les performances du céleri comme dans ce commit.
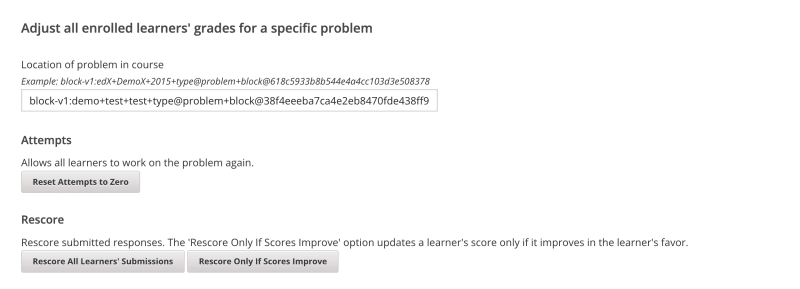
Maintenant, exécutons quelques tâches dans le tableau de bord Open edX pour réinitialiser les tentatives et réévaluer les soumissions des apprenants :

Nous allons accéder au tableau de bordPerformancedans AppSignal ->Événements lentset nous verrons quelque chose comme :

En cliquant sur Céleri, nous verrons toutes les tâches exécutées sur Open edX :

Ce sont d'excellentes informations qui nous aident à voir si nos tâches s'exécutent plus longtemps que prévu, afin que nous puissions résoudre d'éventuels goulots d'étranglement en matière de performances.
Et c'est tout !
Dans cet article, nous avons vu comment AppSignal peut nous donner un aperçu des performances de notre application Django.
Nous avons surveillé une simple application de commerce électronique Django, y compris des métriques telles que les utilisateurs simultanés, les requêtes de base de données et le temps de réponse.
À titre d'étude de cas, nous avons intégré AppSignal à Open edX, révélant comment le suivi des performances peut contribuer à améliorer l'expérience utilisateur, en particulier pour les étudiants utilisant la plateforme.
Bon codage !
P.S. Si vous souhaitez lire les articles Python dès leur sortie de presse, abonnez-vous à notre newsletter Python Wizardry et ne manquez jamais un seul article !
The above is the detailed content of Monitor the Performance of Your Python Django App with AppSignal. For more information, please follow other related articles on the PHP Chinese website!


