


Read in other languages: English Português 中文
There are many debugger tutorials that teach you how to set line breakpoints, log values, or evaluate expressions. While this knowledge alone gives you many tools to debug your application, real-world scenarios can be a little more complicated and require a more advanced approach.
In this article, we will learn how to locate the code that causes a UI crash without much prior knowledge of the project and fix the broken code on the fly.
If you want to follow the example, start by cloning this repository: https://github.com/flounder4130/debugger-example
Suppose you have a complex application that crashes when you perform some action. You know how to reproduce the error, but the difficulty is that you don't know which part of the code is responsible for this functionality.

In our example app, the crash occurs when you click theButton N. However, it is not so easy to find the code that is responsible for this action:

Let's see how we can use the debugger to find it.
The advantage of method breakpoints over line breakpoints is that they can be used in entire class hierarchies. How is this useful in our case?
If you look at the example project, you will see that all action classes are derived from the Action interface with a single method: perform().

Setting a method breakpoint on this interface method will suspend the application every time one of the derived methods is called. To set a method breakpoint, click the line that declares the method.
Start the debugging session and click theButton N. The application is suspended on ActionImpl14. Now we know where the code corresponding to this button is located.

Although in this article we are focused on finding the bug, this technique can also save you a lot of time when you want to understand how something works in a large codebase.
The approach with method breakpoints works well, but it is based on the assumption that we know something about the parent interface. What if this assumption is wrong, or we can't use this approach for some other reason?
Well, we can even do it without breakpoints. Click theButton N, and while the application hangs, go to IntelliJ IDEA. From the main menu, selectRun|Debugging Actions|Pause Program.
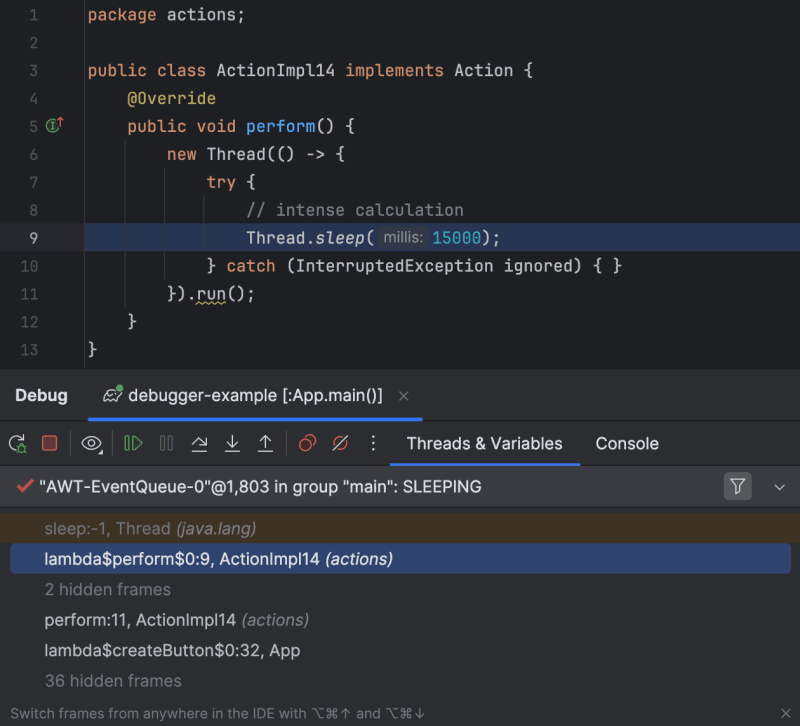
The application will suspend, allowing us to examine the current status of the threads in theThreads & Variablestab. This gives us an idea of what the application is doing at that moment. Since it is hanging, we can identify the method causing the block and trace it back to the call site.
This approach has some advantages over a more traditional thread dump, which we'll cover shortly. For example, it provides you with information about variables in a convenient form and allows you to control further execution of the program.
Tip: For more tips and tricks withPause Programsee Debugging without breakpoints and Debugger.godMode()
Finally, we can use a thread dump, which is not strictly a debugger feature. It is available regardless of whether you are using the debugger.
Click theButton N. While the application is crashing, go to IntelliJ IDEA. From the main menu, selectRun|Debugging Actions|Get Thread Dump.
Explore the available threads on the left, and inAWT-EventQueueyou will see what is causing the problem.

L'inconvénient des thread dumps est qu'ils ne fournissent qu'un instantané de l'état du programme au moment où ils ont été créés. Vous ne pouvez pas utiliser les thread dumps pour explorer des variables ou contrôler l'exécution d'un programme.
Dans notre exemple, nous n'avons pas besoin de recourir à un thread dump. Cependant, je voulais quand même mentionner cette technique car elle peut être utile dans d'autres cas, comme lorsque vous essayez de déboguer une application qui a été lancée sans l'agent de débogage.
Quelle que soit la technique de débogage, nous arrivons à ActionImpl14. Dans cette classe, quelqu'un avait l'intention de faire le travail dans un thread séparé, mais a confondu Thread.start() avec Thread.run(), qui exécute le code dans le même thread que le code appelant.
L'analyseur statique d'IntelliJ IDEA nous en avertit même au moment de la conception :

Une méthode qui fait de gros travaux (ou dort beaucoup dans ce cas) est appelée sur le thread de l'interface utilisateur et le bloque jusqu'à la fin de la méthode. C'est pourquoi nous ne pouvons rien faire dans l'interface utilisateur pendant un certain temps après avoir cliqué sur leBouton N.
Maintenant que nous avons découvert la cause de l'erreur, corrigeons le problème.
Nous pourrions arrêter le programme, recompiler le code puis le réexécuter. Cependant, il n'est pas toujours judicieux de redéployer l'intégralité de l'application simplement parce qu'une petite modification a été apportée.
Faisons-le de manière intelligente. Tout d’abord, corrigez le code à l’aide de la solution rapide suggérée :

Une fois le code prêt, cliquez surExécuter|Actions de débogage|Recharger les classes modifiées. Une bulle apparaît, confirmant que le nouveau code est arrivé dans la VM.

Retournons à l'application et vérifions. Cliquer sur leBouton Nne fait plus planter l'application.
Astuce: Gardez à l'esprit que HotSwap a ses limites. Si vous êtes intéressé par les fonctionnalités étendues de HotSwap, ce serait peut-être une bonne idée de jeter un œil aux outils avancés comme DCEVM ou JRebel
Grâce à notre raisonnement et à quelques fonctionnalités du débogueur, nous avons pu localiser le code qui provoquait un crash de l'interface utilisateur dans notre projet. Nous avons ensuite procédé à la correction du code sans perdre de temps en recompilation et redistribution, qui peuvent être longues dans les projets du monde réel.
J'espère que vous trouverez les techniques décrites utiles. Faites-moi savoir ce que vous en pensez !
Si vous êtes intéressé par d'autres articles liés au débogage et au profilage, consultez certains de mes autres articles :
Restez à l'écoute pour en savoir plus !
The above is the detailed content of Debug Non-Responsive Applications. For more information, please follow other related articles on the PHP Chinese website!
 What to do with the video card
 Why do the words after typing in word disappear?
 How to solve the problem that laptop network sharing does not have permissions?
 oracle insert usage
 What is the difference between ibatis and mybatis
 vivox100s parameter configuration details
 How to install pycharm
 What should I do if my iPad cannot be charged?


![[Web front-end] Node.js quick start](https://img.php.cn/upload/course/000/000/067/662b5d34ba7c0227.png)


