Written at the beginning: In fact, I was thinking about whether to write this thing before, because it is really not difficult, but why do so many people ask? What they ask is not how to use the console, but how to control it. What can the station do? They also know that there are things like console.log, but they don't know why such a long string is used instead of alert to output information. In their eyes, alert is enough. Okay, I admit that I made a small complaint, but in this series I only intend to introduce the basic knowledge of debugging, and will not go into too much depth, because in-depth things are combined with js knowledge. If you have not reached a certain level of js, I will teach you You debug bugs, crack some plug-ins, etc., and you have no idea what I am doing. My purpose is just to let you know the console and let you get started with debugging. You will have to walk the road on your own after that.
Of course, heroes, please pass by, or you can just complain. .
js debugging series directory:
In fact, everyone who does web development knows this, whether it is front-end or back-end, but many people only stay at HTML viewing and CSS modification, and do not use the console at all.
Maybe some people who are just starting out don’t know this exists. .
There is a lot of information on this thing online, but they don't talk about debugging, they just introduce the basic how to use it. .
Whether it is Chrome Firefox IE (version 8 or above) or 360 Rapid Browser Sogou Browser, etc., just press F12 to open the console.
Our article uses chrome as an example. No reason, because I like chrome. . Everyone has their own preferences for radish and cabbage. .
ps: ff The world used to be dominated by firebug, but now the native one is also very good.
Now we press F12 to open the console and click on the Console item.

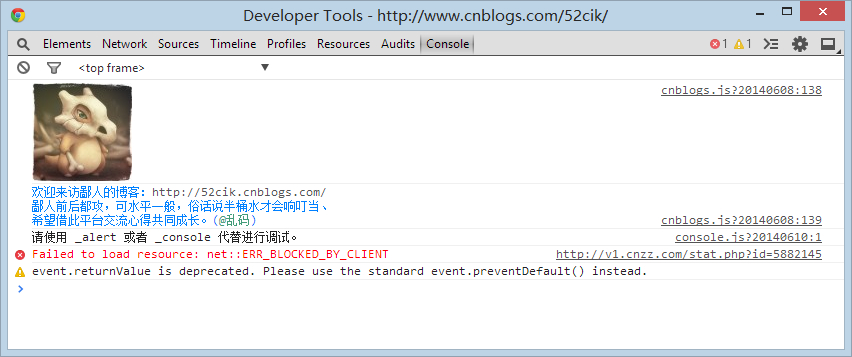
You can see my avatar and a few lines of text, but there are a few lines below, which we will ignore for now and will be explained later.
In fact, for this F12, the most accurate name is developer tools, and Console is the console.
PS: As a basic tutorial, I will only introduce the debugging of Console and Sources. You can learn about other functions by yourself. .
Right-click the Clear console menu or type clear() and press Enter to clear the console content.
Let’s take the first step and use console.log to output information.
Enter console.log("hehe..") and console.log("hehe..", "haha..") respectively and press Enter. You can see the output results on the console.

In fact, it just outputs information, which is very simple. Use it to replace alert and document.write for debugging, and your work will become very easy.
For example, when debugging a loop of code, but there are dozens or even hundreds of elements in the array, you will go crazy if you click alert,
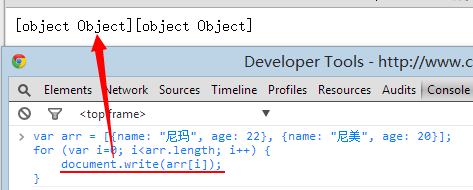
document.write is not impossible, but for object output, you can only see things like [object Object].
This is a real problem encountered by many newcomers.
If you use console.log instead of alert document.write to output object information, you can expand the object in the console to view specific information.
For example:
var arr = [{name: "尼玛", age: 22}, {name: "尼美", age: 20}];
for (var i=0; i<arr.length; i++) {
	console.log(arr[i]);
}
You can directly see the object information without displaying [object Object] which makes us confused.

Did you suddenly feel that console.log was awesome?
In fact, this is just the tip of his iceberg. I will try my best to show you some of his advantages.
Continuing with the previous steps, now we directly enter arr and press Enter.

Isn’t it even more interesting? Now you can directly click Object to expand the objects in this array for viewing, and even the loop output is omitted.
This is the charm of the console, and this is just its most basic function.
Let’s first understand what methods are available for us to use under the console object.
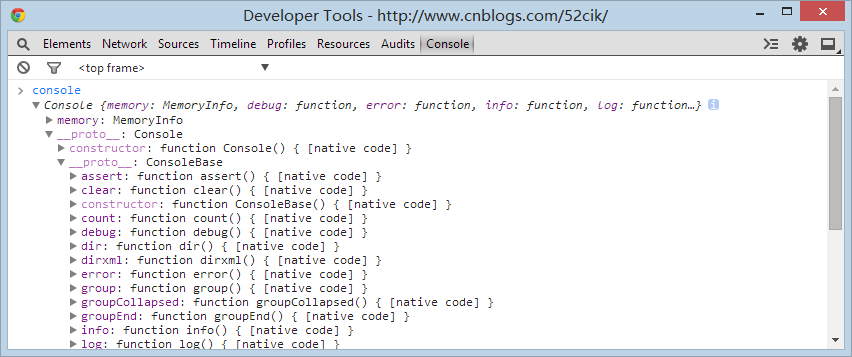
Type console and press Enter to expand this object,

You can see some dark and light things. The dark ones are methods that we can call directly. The light ones represent default attributes or methods. You don’t need to care about the display. We will talk about it later when we have the opportunity.
In fact, only log dir is commonly used. Others are rarely used and will only be used in advanced debugging.
Auxiliary properties such as group and table can be used or not, depending on your preference. I don't really like using it.
Let’s take a look step by step. Anyway, let’s start with the log dir. Most of the debugging depends on them.
PS: In fact, I should give you official documents, but recently it cannot be opened on Google, so you can check the functions of each method on Baidu.
I found a Chinese version, which is pretty good. Please read "console object" first.
Let’s do some after-class exercises: (First open Baidu, then open the console)
1 View the element information with ID kw1 in the console
2 Then use the console.dir method to view the information of the kw1 element


