


在开始之前,了解计算机视觉中的传统坐标系是很重要的。其次是Open3D和Microsoft Kinect传感器。在计算机视觉中,图像用独立的2D坐标系表示,其中x轴从左向右指向,y轴是上下指向。对于相机,3D坐标系原点位于相机的焦点处,x轴指向右,y轴指向下,z轴指向前。
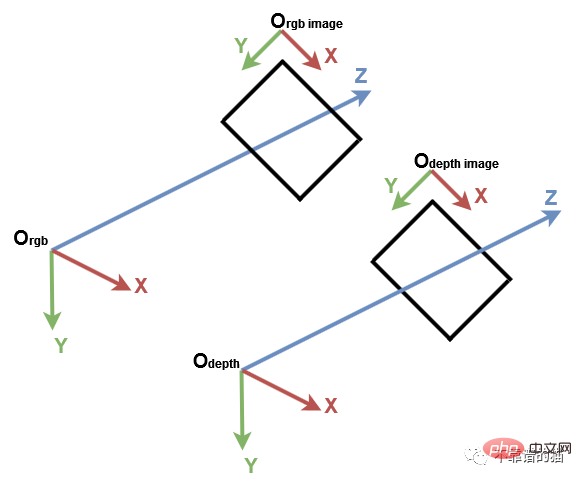
计算机视觉坐标系
我们首先导入所需的Python库:
import numpy as np
import open3d as o3d
为了更好地理解,让我们从 PLY 文件中导入点云,使用 Open3D 创建默认的 3D 坐标系并显示它们:
# Read point cloud:
pcd = o3d.io.read_point_cloud("data/depth_2_pcd.ply")
# Create a 3D coordinate system:
origin = o3d.geometry.TriangleMesh.create_coordinate_frame(size=0.5)
# geometries to draw:
geometries = [pcd, origin]
# Visualize:
o3d.visualization.draw_geometries(geometries)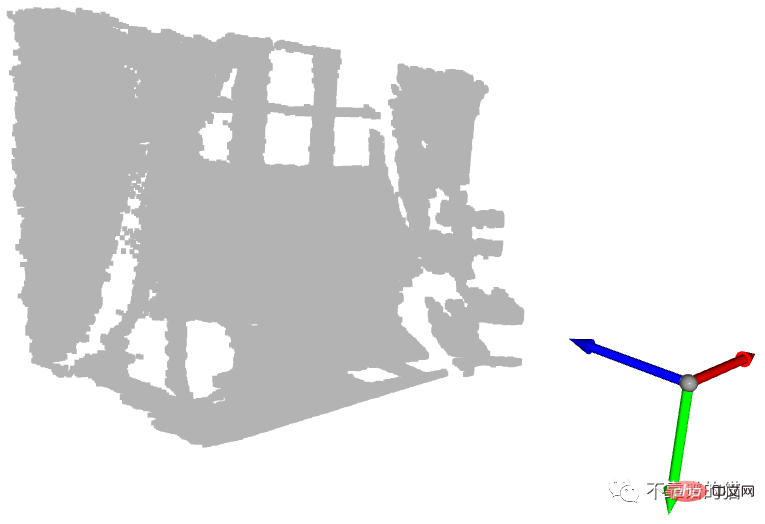
以坐标系原点显示的点云
蓝色箭头是 Z 轴,红色箭头是 X 轴,绿色箭头是 Y 轴。可以看到点云在与Open3D坐标系相同的坐标系中表示。现在,让我们获取具有每个轴的最小值和最大值的点:
# Get max and min points of each axis x, y and z:
x_max = max(pcd.points, key=lambda x: x[0])
y_max = max(pcd.points, key=lambda x: x[1])
z_max = max(pcd.points, key=lambda x: x[2])
x_min = min(pcd.points, key=lambda x: x[0])
y_min = min(pcd.points, key=lambda x: x[1])
z_min = min(pcd.points, key=lambda x: x[2])
我们可以打印它们,但为了更好的可视化,我们在每个点位置创建一个球体。默认情况下,Open3D在原点位置创建3D几何图形:
要将球体移动到给定位置,需要进行平移变换。在下面的示例中,球体以向量 [1,1,1] 平移:
让我们回到我们的示例,为每个球体分配一个颜色。对于每个位置,我们创建一个球体并将其平移到该位置。然后,我们分配正确的颜色,最后我们将它添加到显示。
# Colors:
RED = [1., 0., 0.]
GREEN = [0., 1., 0.]
BLUE = [0., 0., 1.]
YELLOW = [1., 1., 0.]
MAGENTA = [1., 0., 1.]
CYAN = [0., 1., 1.]


positions = [x_max, y_max, z_max, x_min, y_min, z_min]
colors = [RED, GREEN, BLUE, MAGENTA, YELLOW, CYAN]
for i in range(len(positions)):
 # Create a sphere mesh:
 sphere = o3d.geometry.TriangleMesh.create_sphere(radius=0.05)
 # move to the point position:
 sphere.translate(np.asarray(positions[i]))
 # add color:
 sphere.paint_uniform_color(np.asarray(colors[i]))
 # compute normals for vertices or faces:
 sphere.compute_vertex_normals()
 # add to geometry list to display later:
 geometries.append(sphere)


# Display:
o3d.visualization.draw_geometries(geometries)
实际上,y轴代表了点的高度:在现实世界中,最高的球是黄色的球,最低的球是绿色的球。但是,由于y轴向下,黄色球体的值最小,绿色球体的值最大。
另一个有趣的球体是原点上的青色球体。正如我们在上一篇教程中提到的,深度值为0的像素是噪声点,因此位于原点的点是从这些噪声像素计算出来的点(当z=0时,则x=0和y=0)。
现在我们已经展示了一些重要的点,如何进行地面检测呢?在前面的例子中,绿色球体位于地面上。确切地说,它的中心对应于沿y轴的最高点是一个地面点。假设为了地面检测,我们将所有具有y_max的点的颜色都更改为绿
如果显示点云,您会注意到并非所有的地面点都是绿色的。事实上,只有一个与前面绿色球体的中心相对应的点是绿色的。这是由于深度相机的精度和噪声造成的。
为了克服这个限制,我们需要添加一个阈值,以便将y坐标为[y_max-threshold, y_max]的点都视为地面点。为此,在得到y_max后,我们检查每个点的y坐标是否在该区间内,然后将其颜色设置为绿色。最后更新点云的颜色属性并显示结果。
# Define a threshold:
THRESHOLD = 0.075


# Get the max value along the y-axis:
y_max = max(pcd.points, key=lambda x: x[1])[1]


# Get the original points color to be updated:
pcd_colors = np.asarray(pcd.colors)


# Number of points:
n_points = pcd_colors.shape[0]


# update color:
for i in range(n_points):
# if the current point is aground point:
if pcd.points[i][1] >= y_max - THRESHOLD:
pcd_colors[i] = GREEN# color it green


pcd.colors = o3d.utility.Vector3dVector(pcd_colors)


# Display:
o3d.visualization.draw_geometries([pcd, origin])
在本例中,我们只将代表地面的点涂成绿色。在现实世界的应用中,地面被提取来定义可行走的区域,如机器人或视觉障碍系统,或在其上放置物体,如室内设计系统。它也可以被删除,所以剩下的点可以被分割或分类,就像在场景理解和目标检测系统一样。
我们知道点云定义为一组3D点。集合是一种无序结构,因此集合所表示的点云称为无组织点云。与RGB矩阵类似,有组织的点云是一个2D矩阵,有3个通道表示点的x、y和z坐标。矩阵结构提供了相邻点之间的关系,从而降低了一些算法的时间复杂度,如最近邻算法。
举个例子,我们正在写一篇研究论文,我们想用图的形式展示我们的检测算法的结果。我们既可以截取点云的截图,也可以将结果显示在深度图像上,如下图所示。在我看来,第二个选择是最好的。在这种情况下,需要一个有组织的点云来保存深度像素的位置。
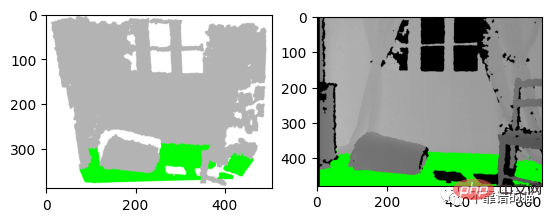
左:3D 可视化的屏幕截图 右:深度图像的结果
让我们从之前的深度图像创建一个有组织的点云。我们首先导入相机参数。我们还导入深度图像并将其转换为3通道灰度图像,以便我们可以将地面像素设置为绿色:
import imageio.v3 as iio
import numpy as np
import matplotlib.pyplot as plt


# Camera parameters:
FX_DEPTH = 5.8262448167737955e+02
FY_DEPTH = 5.8269103270988637e+02
CX_DEPTH = 3.1304475870804731e+02
CY_DEPTH = 2.3844389626620386e+02


# Read depth image:
depth_image = iio.imread('../data/depth_2.png')
# Compute the grayscale image:
depth_grayscale = np.array(256 * depth_image / 0x0fff, dtype=np.uint8)
# Convert a grayscale image to a 3-channel image:
depth_grayscale = np.stack((depth_grayscale,) * 3, axis=-1)要计算一个有组织的点云,我们使用与上一篇教程相同的方法(Python:基于 RGB-D 图像的点云计算)。我们没有将深度图像扁平化,而是将jj和ii重塑为与深度图像相同的形状,如下所示:
# get depth image resolution:
height, width = depth_image.shape
# compute indices and reshape it to have the same shape as the depth image:
jj = np.tile(range(width), height).reshape((height, width))
ii = np.repeat(range(height), width).reshape((height, width))
# Compute constants:
xx = (jj - CX_DEPTH) / FX_DEPTH
yy = (ii - CY_DEPTH) / FY_DEPTH
# compute organised point cloud:
organized_pcd = np.dstack((xx * depth_image, yy * depth_image, depth_image))
如果你打印出创建的点云的形状,你可以看到它是一个有3个通道的矩阵(480,640,3)。如果你觉得这个代码很难理解,请回到之前的教程(Python:基于 RGB-D 图像的点云计算)。
类似地,我们像上面那样检测地面,但不是更新点的颜色并显示点云,而是更新灰度图像的像素并显示它:
# Ground_detection:
THRESHOLD = 0.075 * 1000# Define a threshold
y_max = max(organized_pcd.reshape((height * width, 3)), key=lambda x: x[1])[
1]# Get the max value along the y-axis


# Set the ground pixels to green:
for i in range(height):
for j in range(width):
if organized_pcd[i][j][1] >= y_max - THRESHOLD:
depth_grayscale[i][j] = [0, 255, 0]# Update the depth image


# Display depth_grayscale:
plt.imshow(depth_grayscale)
plt.show()
在本教程中,为了熟悉点云,我们引入了默认坐标系统,并实现了一个简单的地面检测算法。事实上,地面检测在某些应用(如导航)中是一项重要的任务,文献中已经提出了几种算法。实现算法简单;它认为最低点是地面。然而,它的限制是,深度相机必须与地面平行,这是大多数现实应用的情况不是这样的。
以上是利用 Python 实现点云的地面检测的详细内容。更多信息请关注PHP中文网其他相关文章!


