
Das Konzept von Matplotlib wird hier nicht vorgestellt
Der Herausgeber hat Ihnen auch zuvor die von Python mithilfe von Matplotlib erzielten Liniendiagramm- und Kreisdiagrammeffekte mitgeteilt. Klicken Sie hier, um sie anzuzeigen Schauen Sie sich an, wie Python Matplotlib verwendet, um ein Histogramm zu zeichnen:
1. Grundlegendes Histogramm
import matplotlib.pyplot as plt

data = [5, 20, 15, 25, 10]

plt.bar(range(len(data)), data)
plt.show()
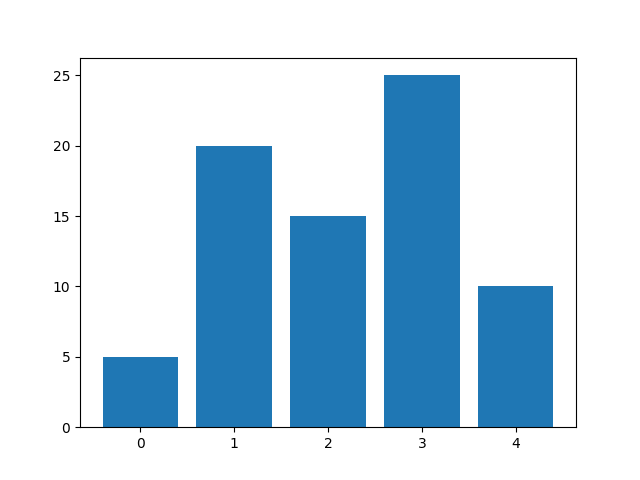
Die Signatur der plt.bar-Funktion lautet:
bar(left, height, width=0.8, bottom=None, **kwargs)
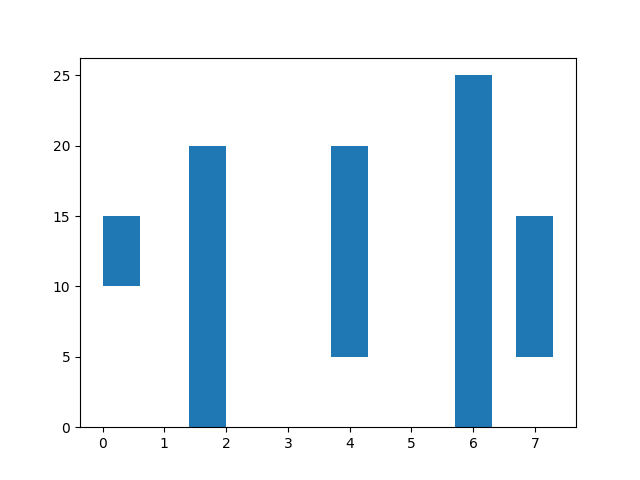
Tatsächlich links, Die vier Die Parameter Höhe, Breite und Boden bestimmen die Position und Größe des Zylinders. Standardmäßig ist links die Mittelposition des Zylinders (die Bedeutung des linken Werts kann über den Ausrichtungsparameter geändert werden), das heißt:
(left - width / 2, bottom) ist die untere linke Ecke Position
(left + width / 2, bottom + height) ist die Position in der oberen rechten Ecke
Zum Beispiel:
import matplotlib.pyplot as plt

data = [5, 20, 15, 25, 10]

plt.bar([0.3, 1.7, 4, 6, 7], data, width=0.6, bottom=[10, 0, 5, 0, 5])
plt.show()
2. Spaltenstil festlegen
(1) Farbe
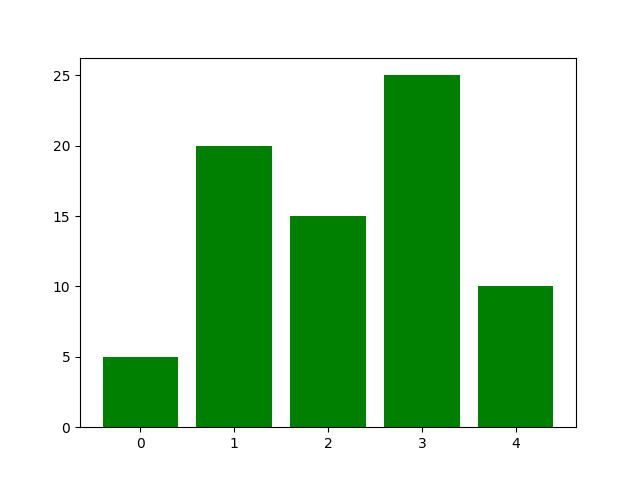
Mit dem Schlüsselwort facecolor (oder fc) können Parameter die Zylinderfarbe festlegen, zum Beispiel:
import matplotlib.pyplot as plt

data = [5, 20, 15, 25, 10]

plt.bar(range(len(data)), data, fc='g')
plt.show()
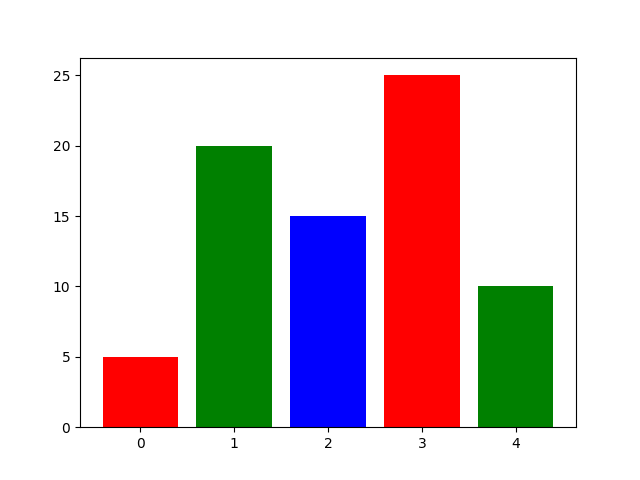
Es kann einmalig über den Schlüsselwortparameter „Farbe“ verwendet werden. Legen Sie mehrere Farben fest, zum Beispiel:
import matplotlib.pyplot as plt

data = [5, 20, 15, 25, 10]

plt.bar(range(len(data)), data, color='rgb') # or `color=['r', 'g', 'b']`
plt.show()
(2) Strich
Die relevanten Schlüsselwortparameter sind:
edgecolor oder ec
linestyle oder ls
Linienbreite oder LW
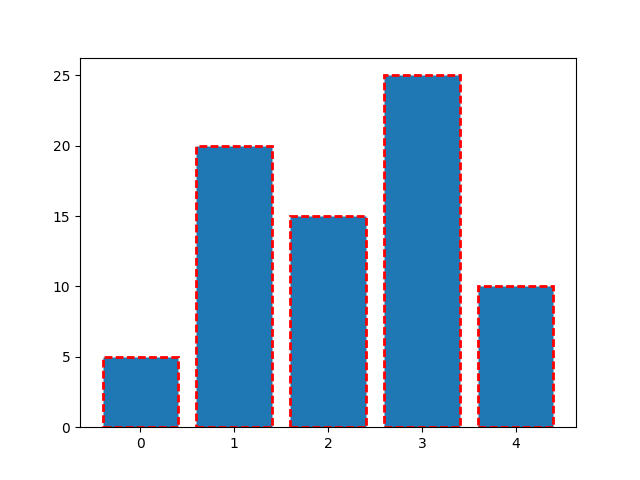
Zum Beispiel:
import matplotlib.pyplot as plt

data = [5, 20, 15, 25, 10]

plt.bar(range(len(data)), data, ec='r', ls='--', lw=2)
plt.show()
(3) Das Schlüsselwort Fill
hatch kann zum Festlegen des Füllstils verwendet werden. Die möglichen Werte sind: /, , |, -, +, x, o, O, ., *. Zum Beispiel:
import matplotlib.pyplot as plt

data = [5, 20, 15, 25, 10]

plt.bar(range(len(data)), data, ec='k', lw=1, hatch='o')
plt.show()
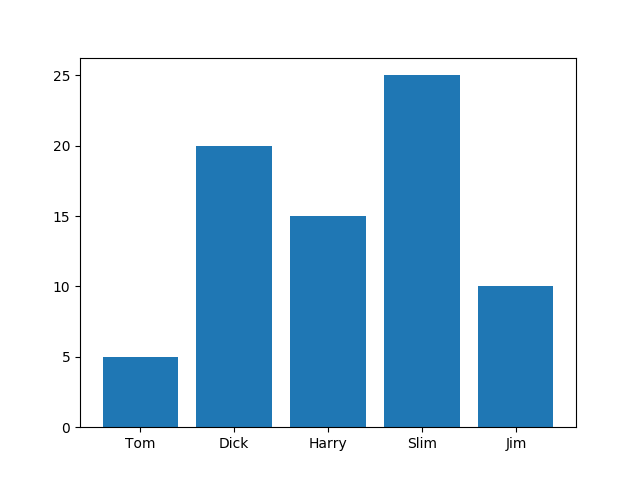
3. Häkchenbezeichnung festlegen
import matplotlib.pyplot as plt

data = [5, 20, 15, 25, 10]
labels = ['Tom', 'Dick', 'Harry', 'Slim', 'Jim']

plt.bar(range(len(data)), data, tick_label=labels)
plt.show()
4. Gestapeltes Säulendiagramm
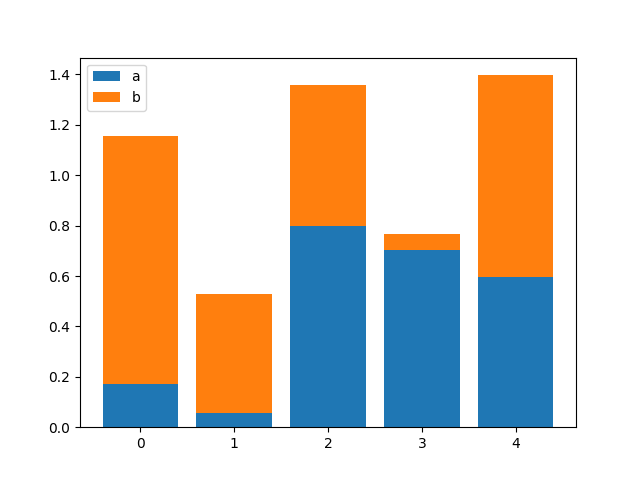
Wenn Sie den unteren Parameter übergeben, können Sie ein gestapeltes Säulendiagramm zeichnen. Zum Beispiel:
import numpy as np
import matplotlib.pyplot as plt

size = 5
x = np.arange(size)
a = np.random.random(size)
b = np.random.random(size)

plt.bar(x, a, label='a')
plt.bar(x, b, bottom=a, label='b')
plt.legend()
plt.show()
5. Nebeneinander angeordnetes Säulendiagramm
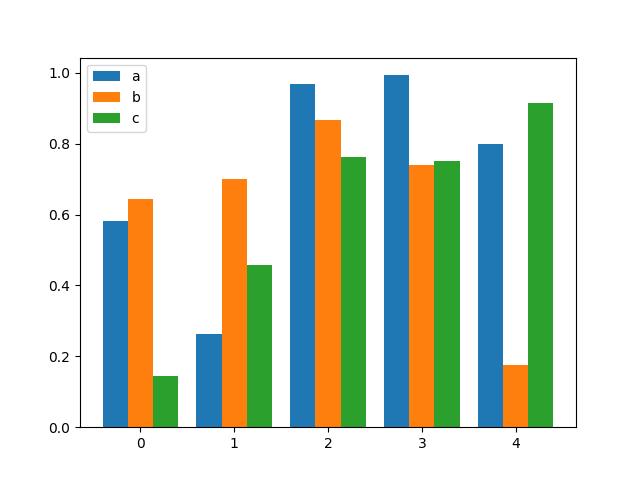
Das Zeichnen nebeneinander liegender Säulendiagramme ähnelt dem Zeichnen mehrerer Säulengruppen. Sie müssen lediglich die Position und Größe jeder Säulengruppe steuern. Zum Beispiel:
import numpy as np
import matplotlib.pyplot as plt

size = 5
x = np.arange(size)
a = np.random.random(size)
b = np.random.random(size)
c = np.random.random(size)

total_width, n = 0.8, 3
width = total_width / n
x = x - (total_width - width) / 2

plt.bar(x, a, width=width, label='a')
plt.bar(x + width, b, width=width, label='b')
plt.bar(x + 2 * width, c, width=width, label='c')
plt.legend()
plt.show()
6. Balkendiagramm
Verwenden Sie die Barh-Methode, um ein Balkendiagramm zu zeichnen. Zum Beispiel:
import matplotlib.pyplot as plt

data = [5, 20, 15, 25, 10]

plt.barh(range(len(data)), data)
plt.show()
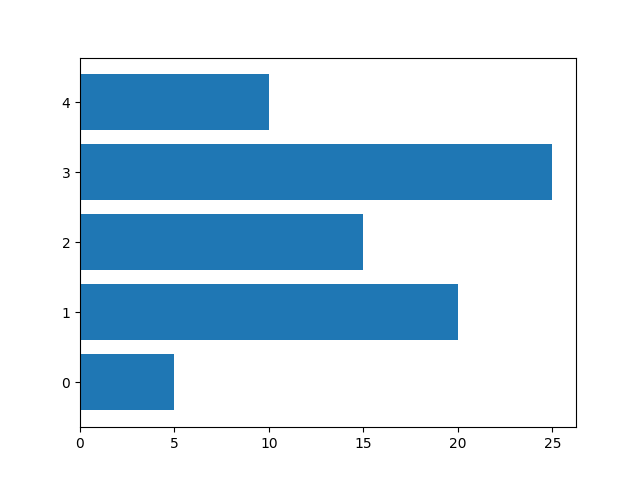
Die Signatur der plt.barh-Methode lautet:
barh(bottom, width, height=0.8, left=None, **kwargs)
Sie können sehen, dass es der plt.bar-Methode ähnelt. Daher ähneln die Zeichenmethoden für gestapelte Balkendiagramme und nebeneinander liegende Balkendiagramme den vorherigen und werden nicht im Detail beschrieben.
7. Positives und negatives Balkendiagramm
import numpy as np
import matplotlib.pyplot as plt

a = np.array([5, 20, 15, 25, 10])
b = np.array([10, 15, 20, 15, 5])

plt.barh(range(len(a)), a)
plt.barh(range(len(b)), -b)
plt.show()
Weitere Python-Tutorials zur Verwendung von Matplotlib zum Zeichnen von Histogrammen finden Sie auf der chinesischen PHP-Website!


