
Bonjour, Dans le blog précédent, nous avons expliqué comment effectuer une analyse raster à l'aide des index h3 et de postgresql pour un raster à bande unique. Dans ce blog, nous expliquerons comment traiter les rasters multicanaux et créer facilement des indices. Nous utiliserons l'image sentinelle-2, créerons un NDVI à partir des cellules h3 traitées et visualiserons les résultats
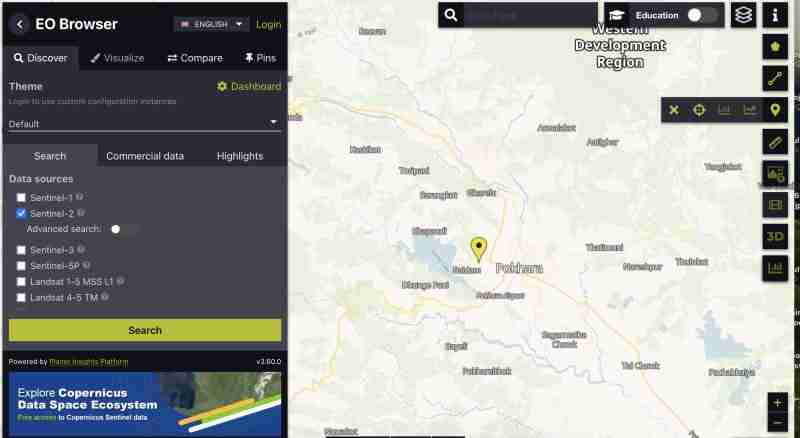
Nous téléchargeons les données Sentinel 2 depuis https://apps.sentinel-hub.com/eo-browser/ à Pokhara, dans la région du Népal, juste pour nous assurer que le lac est dans la grille d'images afin qu'il nous soit facile de valider le résultat NDVI
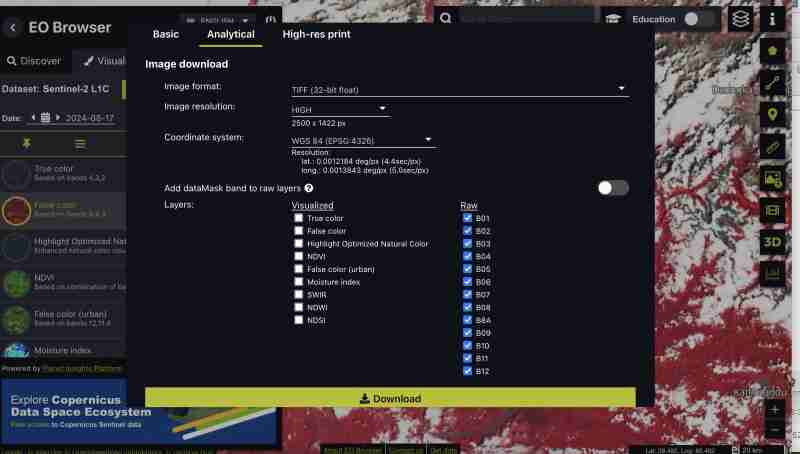
Pour télécharger l'image sentinelle avec toutes les bandes :
 dans la barre verticale droite
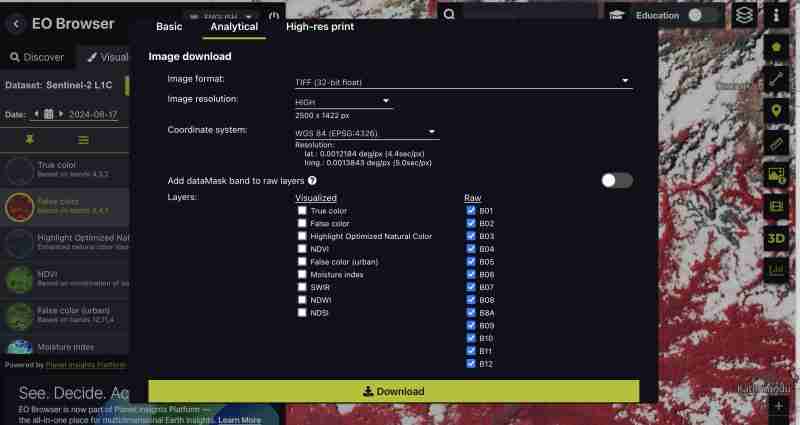
Vous pouvez également télécharger des indices prégénérés tels que NDVI, False Color Tiff uniquement ou des bandes spécifiques selon ce qui correspond le mieux à vos besoins. Nous téléchargeons tous les groupes car nous voulons faire le traitement nous-mêmes
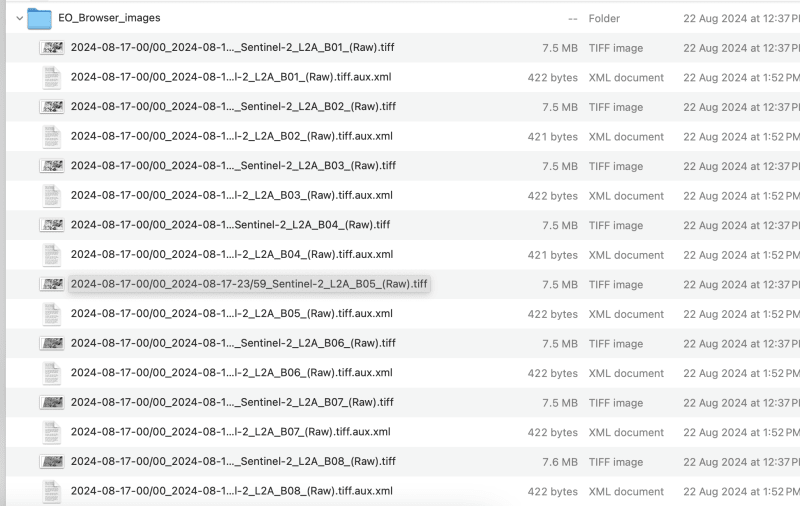
Nous obtenons tous les groupes sous forme de tiff distinct de la sentinelle au fur et à mesure que nous téléchargeons le format brut
Cela peut être fait via des outils SIG ou gdal
Nous devons renommer le fichier téléchargé en band1,band2 comme ceci pour éviter les barres obliques dans le nom du fichier
Traitons jusqu'à la bande 9 pour cet exercice, vous pouvez choisir la bande selon vos besoins
gdal_merge.py -separate -o sentinel2_composite.tif band1.tif band2.tif band3.tif band4.tif band5.tif band6.tif band7.tif band8.tif band9.tif
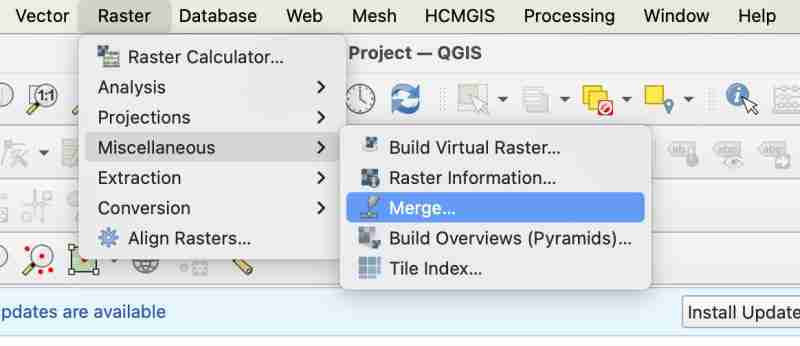
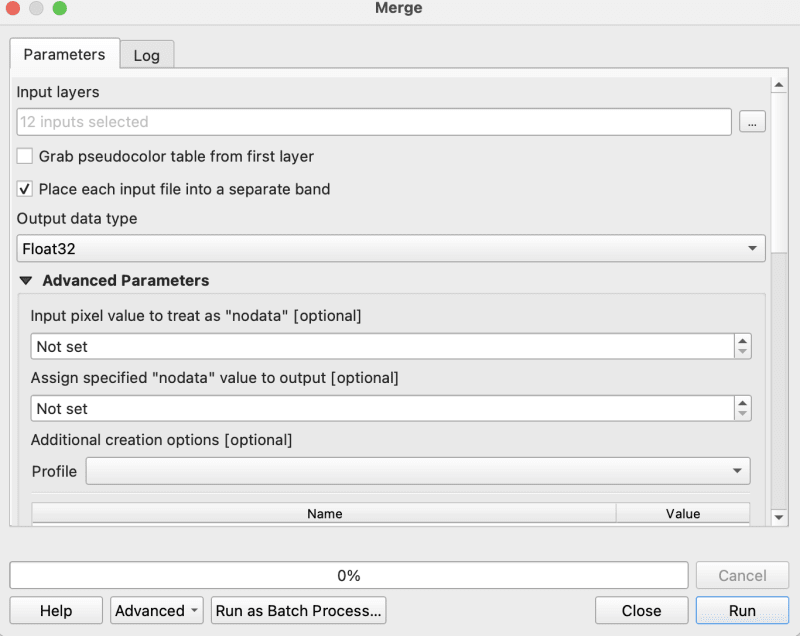
gdalwarp -overwrite -dstnodata 0 "$input_file" "${output_file}_nodata.tif"
gdal_translate -of COG "$input_file" "$output_file"
J'utilise le script bash fourni dans le dépôt cog2h3 pour les automatiser
sudo bash pre.sh sentinel2_composite.tif
Maintenant, enfin, après avoir effectué le script de prétraitement, passons au calcul des cellules h3 pour chaque bande de l'image de rouage composite
pip install cog2h3
export DATABASE_URL="postgresql://user:password@host:port/database"
Nous utilisons la résolution 10 pour cette image sentinelle, mais vous verrez également dans le script lui-même qui imprimera la résolution optimale pour votre raster qui rend la cellule h3 plus petite que votre plus petit pixel dans le raster.
cog2h3 --cog sentinel2_composite_preprocessed.tif --table sentinel --multiband --res 10
Il nous a fallu une minute pour calculer et stocker le résultat dans postgresql
Journaux :
2024-08-24 08:39:43,233 - INFO - Starting processing 2024-08-24 08:39:43,234 - INFO - COG file already exists at sentinel2_composite_preprocessed.tif 2024-08-24 08:39:43,234 - INFO - Processing raster file: sentinel2_composite_preprocessed.tif 2024-08-24 08:39:43,864 - INFO - Determined Min fitting H3 resolution for band 1: 11 2024-08-24 08:39:43,865 - INFO - Resampling original raster to: 200.786148m 2024-08-24 08:39:44,037 - INFO - Resampling Done for band 1 2024-08-24 08:39:44,037 - INFO - New Native H3 resolution for band 1: 10 2024-08-24 08:39:44,738 - INFO - Calculation done for res:10 band:1 2024-08-24 08:39:44,749 - INFO - Determined Min fitting H3 resolution for band 2: 11 2024-08-24 08:39:44,749 - INFO - Resampling original raster to: 200.786148m 2024-08-24 08:39:44,757 - INFO - Resampling Done for band 2 2024-08-24 08:39:44,757 - INFO - New Native H3 resolution for band 2: 10 2024-08-24 08:39:45,359 - INFO - Calculation done for res:10 band:2 2024-08-24 08:39:45,366 - INFO - Determined Min fitting H3 resolution for band 3: 11 2024-08-24 08:39:45,366 - INFO - Resampling original raster to: 200.786148m 2024-08-24 08:39:45,374 - INFO - Resampling Done for band 3 2024-08-24 08:39:45,374 - INFO - New Native H3 resolution for band 3: 10 2024-08-24 08:39:45,986 - INFO - Calculation done for res:10 band:3 2024-08-24 08:39:45,994 - INFO - Determined Min fitting H3 resolution for band 4: 11 2024-08-24 08:39:45,994 - INFO - Resampling original raster to: 200.786148m 2024-08-24 08:39:46,003 - INFO - Resampling Done for band 4 2024-08-24 08:39:46,003 - INFO - New Native H3 resolution for band 4: 10 2024-08-24 08:39:46,605 - INFO - Calculation done for res:10 band:4 2024-08-24 08:39:46,612 - INFO - Determined Min fitting H3 resolution for band 5: 11 2024-08-24 08:39:46,612 - INFO - Resampling original raster to: 200.786148m 2024-08-24 08:39:46,619 - INFO - Resampling Done for band 5 2024-08-24 08:39:46,619 - INFO - New Native H3 resolution for band 5: 10 2024-08-24 08:39:47,223 - INFO - Calculation done for res:10 band:5 2024-08-24 08:39:47,230 - INFO - Determined Min fitting H3 resolution for band 6: 11 2024-08-24 08:39:47,230 - INFO - Resampling original raster to: 200.786148m 2024-08-24 08:39:47,239 - INFO - Resampling Done for band 6 2024-08-24 08:39:47,239 - INFO - New Native H3 resolution for band 6: 10 2024-08-24 08:39:47,829 - INFO - Calculation done for res:10 band:6 2024-08-24 08:39:47,837 - INFO - Determined Min fitting H3 resolution for band 7: 11 2024-08-24 08:39:47,837 - INFO - Resampling original raster to: 200.786148m 2024-08-24 08:39:47,845 - INFO - Resampling Done for band 7 2024-08-24 08:39:47,845 - INFO - New Native H3 resolution for band 7: 10 2024-08-24 08:39:48,445 - INFO - Calculation done for res:10 band:7 2024-08-24 08:39:48,453 - INFO - Determined Min fitting H3 resolution for band 8: 11 2024-08-24 08:39:48,453 - INFO - Resampling original raster to: 200.786148m 2024-08-24 08:39:48,461 - INFO - Resampling Done for band 8 2024-08-24 08:39:48,461 - INFO - New Native H3 resolution for band 8: 10 2024-08-24 08:39:49,046 - INFO - Calculation done for res:10 band:8 2024-08-24 08:39:49,054 - INFO - Determined Min fitting H3 resolution for band 9: 11 2024-08-24 08:39:49,054 - INFO - Resampling original raster to: 200.786148m 2024-08-24 08:39:49,062 - INFO - Resampling Done for band 9 2024-08-24 08:39:49,063 - INFO - New Native H3 resolution for band 9: 10 2024-08-24 08:39:49,647 - INFO - Calculation done for res:10 band:9 2024-08-24 08:39:51,435 - INFO - Converting H3 indices to hex strings 2024-08-24 08:39:51,906 - INFO - Overall raster calculation done in 8 seconds 2024-08-24 08:39:51,906 - INFO - Creating or replacing table sentinel in database 2024-08-24 08:40:03,153 - INFO - Table sentinel created or updated successfully in 11.25 seconds. 2024-08-24 08:40:03,360 - INFO - Processing completed
Depuis que nous avons nos données dans postgresql, faisons quelques analyses
select * from sentinel

explain analyze select h3_ix , (band8-band4)/(band8+band4) as ndvi from public.sentinel
Plan de requête :
QUERY PLAN | -----------------------------------------------------------------------------------------------------------------+ Seq Scan on sentinel (cost=0.00..28475.41 rows=923509 width=16) (actual time=0.014..155.049 rows=923509 loops=1)| Planning Time: 0.080 ms | Execution Time: 183.764 ms |
As you can see here for all the rows in that area the calculation is instant . This is true for all other indices and you can compute complex indices join with other tables using the h3_ix primary key and derive meaningful result out of it without worrying as postgresql is capable of handling complex queries and table join.
Lets visualize and verify if the computed indices are true
create table ndvi_sentinel as( select h3_ix , (band8-band4)/(band8+band4) as ndvi from public.sentinel )
ALTER TABLE ndvi_sentinel ADD COLUMN geometry geometry(Polygon, 4326) GENERATED ALWAYS AS (h3_cell_to_boundary_geometry(h3_ix)) STORED;
create index on ndvi_sentinel(geometry);
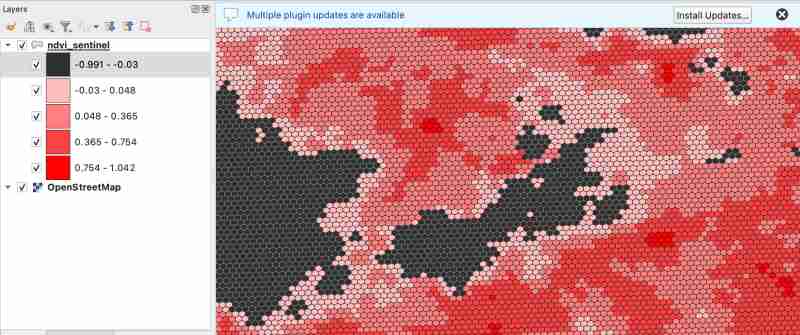
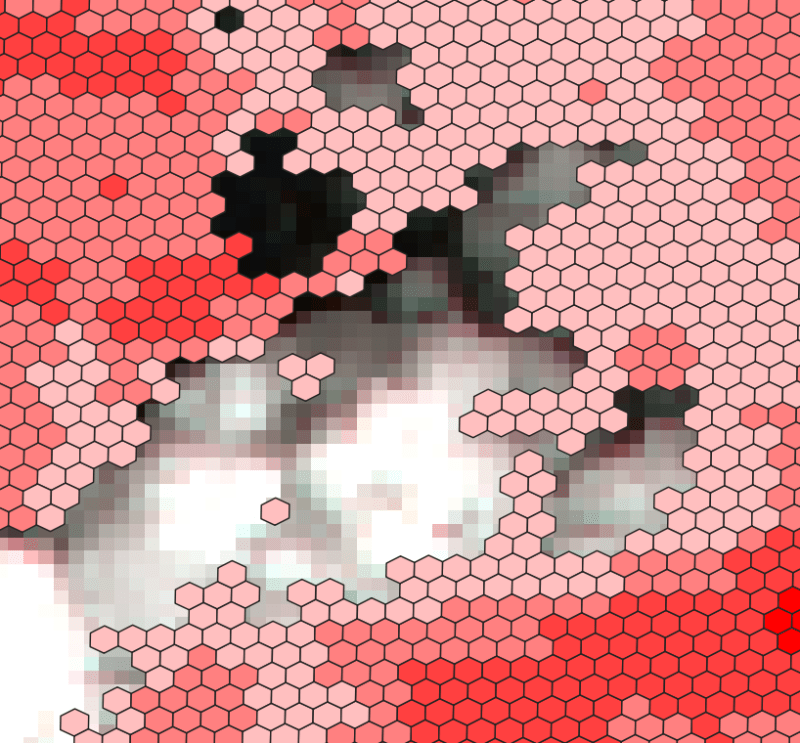
As we know value between -1.0 to 0.1 should represent Deep water or dense clouds
lets see if thats true ( making first category as transparent to see the underlying image )
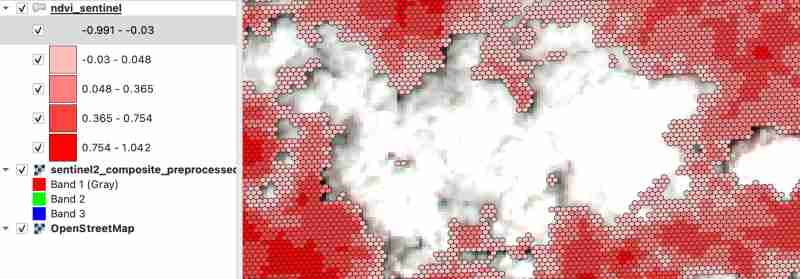
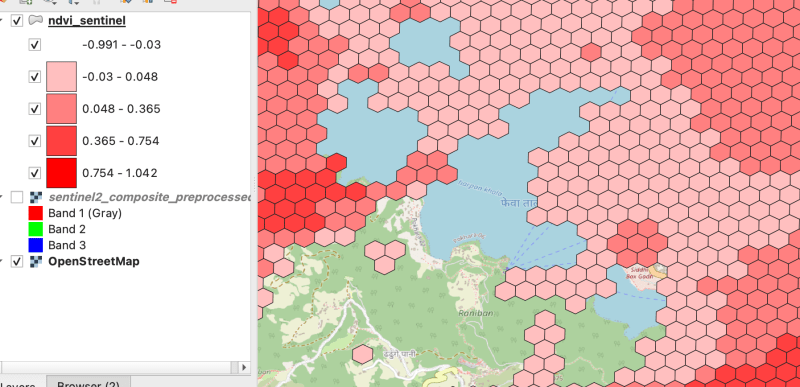
As there were clouds around the lake hence nearby fields are covered by cloud which makes sense
Thank you for reading ! See you in next blog
Das obige ist der detaillierte Inhalt vonVerarbeiten Sie Multiband-Raster (Sentinel-mit hndex und erstellen Sie Indizes. Für weitere Informationen folgen Sie bitte anderen verwandten Artikeln auf der PHP chinesischen Website!


